Module 6 Unmanned Aerial Systems for Earth Observations
6.1 Preliminaries
6.1.1 Readings
Readings should be done when referenced during this week’s lesson. Do not read before starting the lesson.
6.1.2 Learning Objectives
By the end of this lesson, students will be able to:
- Describe characteristics of differnt types of UAS in terms of mapping
- List common sensors available for UAS-based mapping
- Find examples of geospatial applications or UAS-generated data
- Overview key regulations that pertain to operating UAS in Canada
Activities for Module 6
- Readings
- Assignment A-M6
- Quiz Q-M6
Optional: Reading report [3 total for the course], Participation [minimum of 4 total for the course]
6.2 UAS for Mapping
Drones! When used for environmental research and monitoring, a drone is actually one component in what is commonly called an unmanned aerial system. The components of a UAS include:
- the Unmanned Aerial Vehicle (UAV) - aka drone
- Radio/GPS
- Flight control
- A pilot
- Controller
- Flight programming software
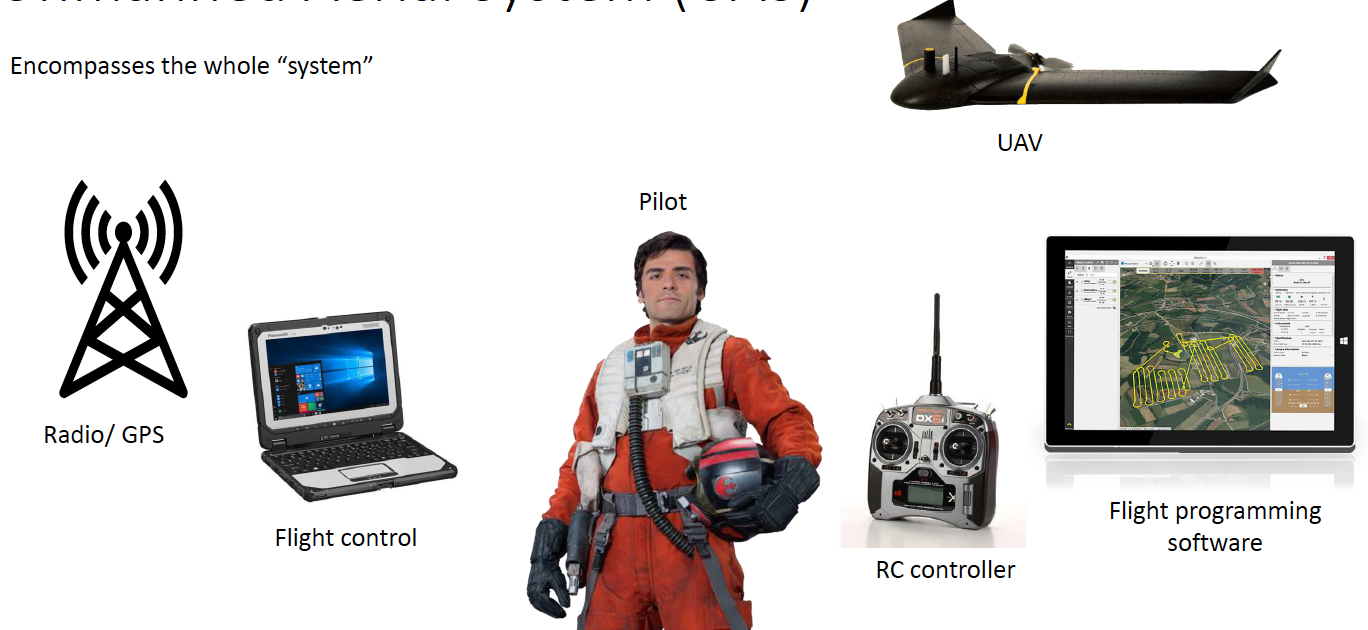
Figure 6.1: Components of an unmanned aerial system, image credit: Branden Walker
In order to understand the role that UAS play in the field of environmental monitoring and research, we can compare them to competing platforms for collecting geospatial imagery. As we have seen in Week 2, satellite based earth observation is an increasingly popular method of acquiring earth information. There are several important differences between satellite-based EO and UAS-based mapping:
Charcteristic | Satellite | UAS |
Deployment | Fixed orbits and data can only be acquired during a pass over the target site | UAS can be deployed anytime local conditions/regulations permit |
Spatial Resolution | Several or hundreds of meters | High/very high, acquiring images where each pixel is centimeters |
Temporal Resolution | For quickly moving phenomena that require rapid mapping (e.g., wildfire spread), satellite EO may not have fine enough temporal resolution (i.e., revisit times) | Can be deployed at any desired temporal resolution |
Spectral characteristics | In general, *most* UAS have less spectral bands than what is commonly available from EO sensors. However advanced sensors can be mounted on UAS including thermal, lidar, and hyperspectral sensors | Wide variety of sensors available for multi and hyperspectral sensors |
Operational considerations | In EO data, all of the planning and complexity goes into putting the satellite in orbit, so once it is there it stays somewhat predictable. | Greater operational considerations in flying UAS for data collection than in obtaining EO data from a satellite. Ground-based considerations can be a big factor in where you can and where you can't fly a UAV. Meticulous planning is required to carry out a UAS mission for image acquisition. |
So UAS can play a critical role in the collection of geospatial information when information needs require high spatial resolution imagery over a relatively small region, and ground conditions dictate that flying a UAV is legal, safe, and will generate useful geospatial data.
6.2.1 Platforms
A key distinction between mapping UAVs and generic drones (even though these categories can and do overlap), is that those used for mapping must have automated flight capability. That is, a flight plan is set in advance and the UAV carries out the flight plan via autonomous flight. Usually flights are guided by GPS on board the UAV itself as well as capability to be radio controlled with a remote control. There are two main platforms designs used in UAS mapping.
Multi-rotor UAVs are vehicles with several top-mounted propellers which can maneurver into difficult spots and can be engaged to follow targets, avoid objects, and hover in the same position. The rotor engines move in alternating directions and a series of sensors automatically adjusts for effects of wind and momementum to keep the platform stable. Flying times for multi-copters vary widely, but usually range from 20 mins to 1 hr. As such these platforms are typically used for mapping small areas within line of sight of the operators. Rotary-UAVs can take off and land vertically, enabling them to be launched from small areas / complex terrain (e.g., in forest canopy).
 Licensed under Creative Commons 4.0.](images/platforms.jpg)
Figure 6.2: Fixed wing and multi-rotor platforms for UAV mapping. Licensed under Creative Commons 4.0.
Fixed-wing platforms have a central body and usually rear or front-mounted engines and/or electric-powered propellers that drive the vehicle forward, generating lift under their wings. Air speed and direction sensors and ailerons control/steer the UAV. Fixed-wind UAVs cannot hover, but have a larger range, can cover large areas in a single flight (~100 ha), and generally offer more stable conditions for image acquisition. For these reasons many mapping UAVs have been designed as fixed-wing UAVs. Take off and landing of fixed-wing UAVs require clear and open areas.
Stop and Think - 1
Imagine you are working for a species-at-risk program focused on birds using specific types of farm as critical habitat. The program aims to identify potential sites for more detailed surveying, which tend to be near small and medium size ponds/water features (~.05 ha - .50 ha) in the spring. The area of interest is bounded by St. Jacobs on the south end, Winterbourn and West Montrose to the east, Elimira to the north, and Hawkseville and St. Clements to the west. Which type of platform (satellite EO, fixed-wing UAS, rotary UAS) would you use for this project and why?
6.2.2 Sensors
Just like a camera can have different lenses, a UAV platform can be outfitted with different sensors. Sensors differ in terms of what types of light they are sensitive and whether they are a passive or active sensor. Passive sensors record reflected light and are basically cameras that image the ground. While UAV-based cameras can be controlled and take images at a variety of angles, for mapping we usually want a vertical orientation for the photo, so that distortions near the edges of the photo are minimized. Passive sensors can be sensitve to visible light just like a normal camera, or as a multi-spectral sensor where Red/Green/Blue light is sensed separately as distinct image channels. With multi-spectral, data the image channels can then be manipulated and enhanced in different ways. A near-infrared channel is often part of multi-spectral sensors, which are able to see into part of the electromagnetic spectrum that that we can’t see with the human eye. This is especially important for monitoring vegetation health, detecting stress in plants and crops before they might be visible with the human eye. For this reason, UAVs have become increasingly used in agriculture.
Another type of sensor common in UAV mapping is a thermal infrared sensor.If you have ever seen any of the Predator movies you have seen thermal imagery. A thermal sensor as you might expect sense temperature differences of the scene it is imaging. Thermal sensors are typically much more expensive than standard visible-range sensors. A thermal sensor on an UAV can be used for different applications. For example, because water content is correlated with temperature, thermal variation can detect drought stress in plants or leaks in pipelines. One key advantage of UAV mapping is that different sensors can be added to a UAV platform for a specific project, greatly expanding the types of environmental projects a single UAV can contribute to.
Stop and Do - 1
Having reviewed some of the potential uses of UAVs in agriculture. write down three potential issues that might arise in deploying UAVs in an agricultural context
The second type of sensor is active sensors which transmit energy and record what is reflected back by the surface. The type of energy transmitted differs depending on the type of active sensing, but the most common for UAV mapping is called light detection and ranging (LiDaR). LiDaR data sends electromagnetic energy pulses as waves in the near infrared part of the spectrum (.90 \(\mu\)m and 1.5\(\mu\)m - which are micrometers or units of \(10^{-6}\)m in length).
6.3 3D Mapping from UAS
One of the fundamental differences between traditional mapping and the digital earth, is in the treatment of the third dimension, elevation. In the early days of computer mapping and GIS, research and development efforts primarily focused on automating the process of mapping using computers. To this end, the objective was still to make a two-dimensional map that could be plotted on a piece of paper, rather than to use the digital representation itself as a new way to model the earth and geographic processes. While much progress has been made, elements of traditional 2D mapping remain rooted in many GIS and mapping applications.
However, 3-dimensional representations are increasing and new data models and methods are being developed to generate, manage, analyze and visualize geographic information in full 3-dimensional detail. UAVs have been on the forefront of these changes through the method of structure-from-motion photogrammetry. Before we explore this exciting new technology, we can briefly review what traditional photogrammetry is.
Photogrammetry is what it sounds like: making measurements from photographs. In the context of mapping this means measuring both distances and heights from aerial photographs. Photogrammetry has traditionally employed with aerial photography taken from aircraft. A key property of photogrammetric work is to exploit the property of parallax which is the apparent shift in the position of an object when viewed from different perspectives. Classic photogrammetry used overlapping photographs and a viewing device called a stereoscope to see in stereo and view portions of the sensed area in 3D. Thus measurements can be made between the base and top of an object for example, to measure its height. Here is an example of a classic stereoscope set-up for airphoto interpretation (4:17).
While photogrammetry is useful for making measurements of 3-dimensional objects in aerial photography, the visualization and exploration of 3D environmental data was limited. We will see how UAVs have drastically changed 3D measurements and visualization of geospatial data at very high resolution.
6.3.1 Structure from Motion Photogrammetry
Classic photogrammetry using steroscope viewers or even more advanced set ups using computer-vision devices are primarily a manual process of interacting with geospatial data to link and measure aspects of the scene in the photographs. A new type of photogrammetry has emerged in the last decade which is almost entirely automated. Structure-from-motion photogrammetry works according to the same principles as classic photogrammetry;
- obtaining overlapping images along the flightline,
- identifying the same objects in adjacent aerial images,
- and calculating their geometric properties through triangulation of the object in multiple scenes.
The key innovation here is that instead of having to match objects manually; thousands of tie points are generated which map the same locations in multiple images together. Because the triangulation of objects in the scene is three-dimensional, we can use SFM to generate 3D representations of the landscape called an SFM point cloud.
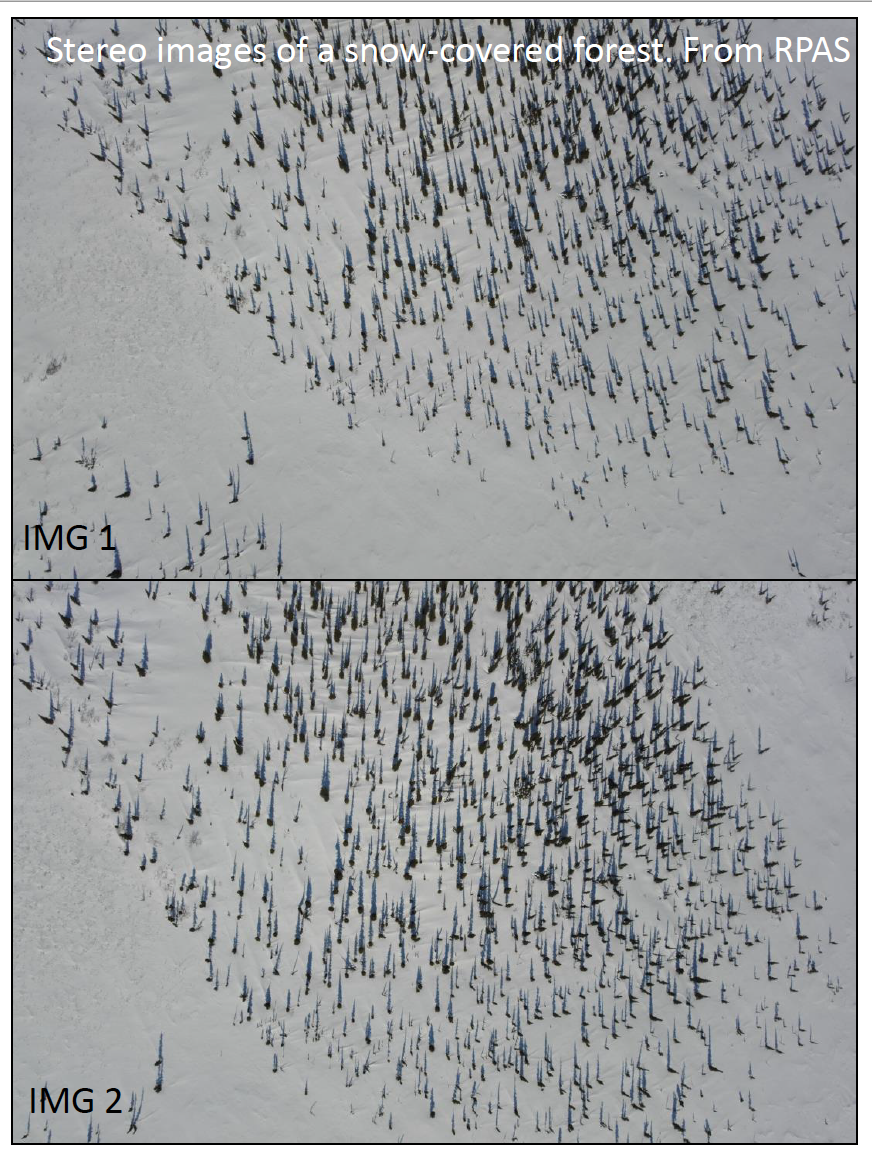
Figure 6.3: Adjacent aerial images obtained from a UAV in northern Canada, image source: Branden Walker. Used with permission.
We see in the image above two adjacent images from a UAV mapping campaign in northern Canada. The success of an SFM analysis of images is to successfully identify objects in multiple scenes so their position can be triangulated. This requires substantial variability to be present in the scene so the same points in multiple images can be linked. Examples are things like the bases of trees, tops of trees, shadows, differences in snow textures etc.
Stop and Do - 2
Can you think of any environments or landscapes where SFM might not work? Why would that be?
Perhaps the most important part of SFM is what we can generate from the triangulated image objects in the scene. Because we have 3-dimensional coordinates, we can generate 3-dimensional imagery outputs which allow us to explore three dimensional structure of landscapes. Have a look at this 3D point cloud (0:59) obtained from UAV flight campaign and SFM processing of the data;
SFM can also generate digital surface models (DSM) where the height of the surface (e.g., tops of trees) is computed from the point cloud as well as a digital elevation model (DEM) where the ground/terrain elevation is computed (e.g., based of trees). These three derived products; point clouds, DSMs, and DEMs can be used in a wide array of geospatial applications and serve as important basemap data for the study site.
Stop and Do - 3
What added benefit is there to viewing the landscape in 3D as opposed to a standard 2D map?
6.3.2 Case Study: Drones for mapping snow in northern Canada
Several researchers at Laurier incorporate UAS into their research programmes for environmental data collection and mapping. One group of researchers, led by Professor Phil Marsh - have pioneered a snow mapping method using fixed-wing UAVs. Working primarily north of the treeline at Trail Valley Creek Arctic Research Station. One of the group’s research objectives is to monitor snowpack and how it changes over time. Utilizing structure-from-motion photogrammetry, the team use UAVs to generate a digital surface map of a study site during the summer months as a baseline elevation datum.
During winter when there is snowcover, they fly another UAV route to generate at winter DSM. Now for each pixel we have two values, the height above mean sea level without snow, and the height above mean sea level with snow, and therefore subtracting one from the other gives you the snow depth (make sure you understand this).
In this way, the team can fly multiple UAV mapping campaigns through the winter to monitor the snowpack over time. This has important implications for understanding the hydrological regime of the area and how it is responding to changes in climate.
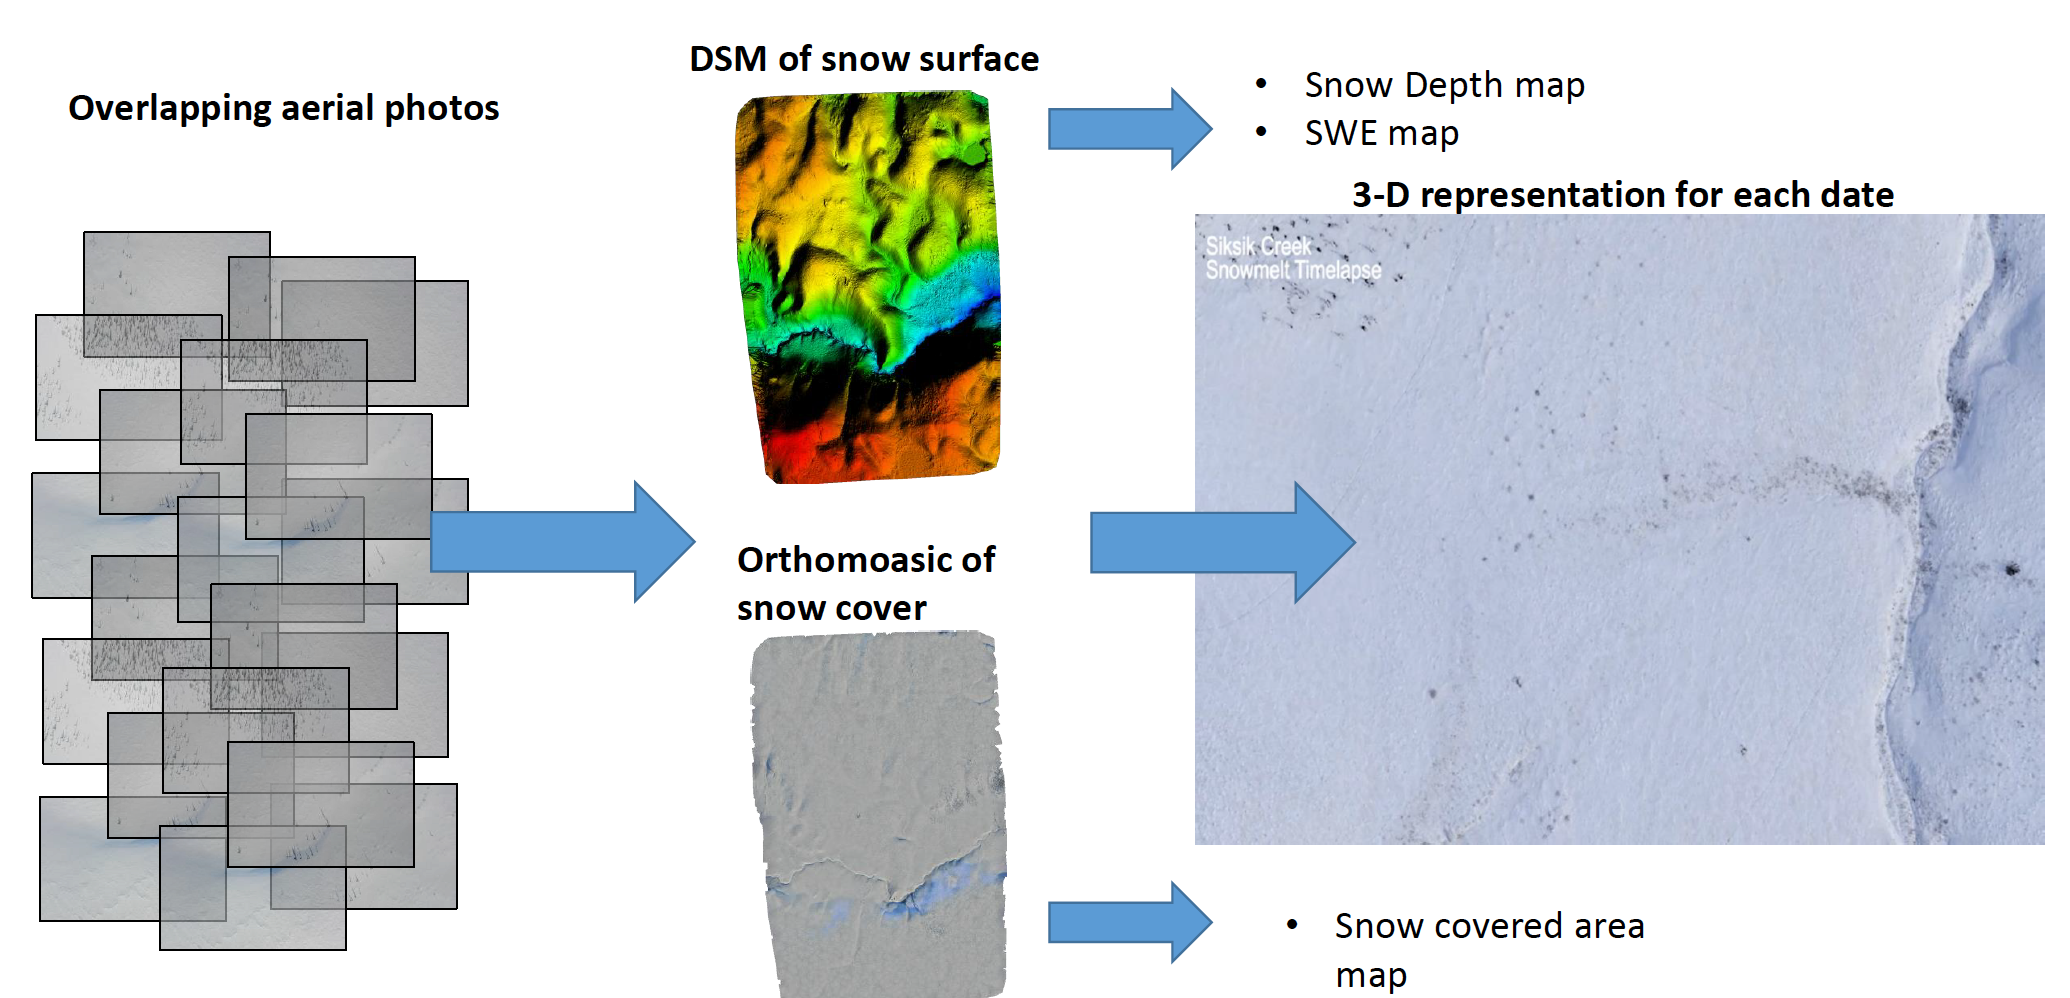
Figure 6.4: Mapping snow depth using structure-from-motion photogrammetry and unmanned aerial vechicles, image credit: Branden Walker
And here we can see the SFM-derived changes in snow water equivalent during the melt period in the landscape. [Note: snow-water equivalent (SWE) is the amount of water contained in the snowpack and is an important hydrological indicator]. Visualizing how snow differentially melts in relation to landcover and vegetation classes helps to extrapolate water balance changes across the wider landscape where land cover classes can be mapped but are too large for detailed UAV mapping.
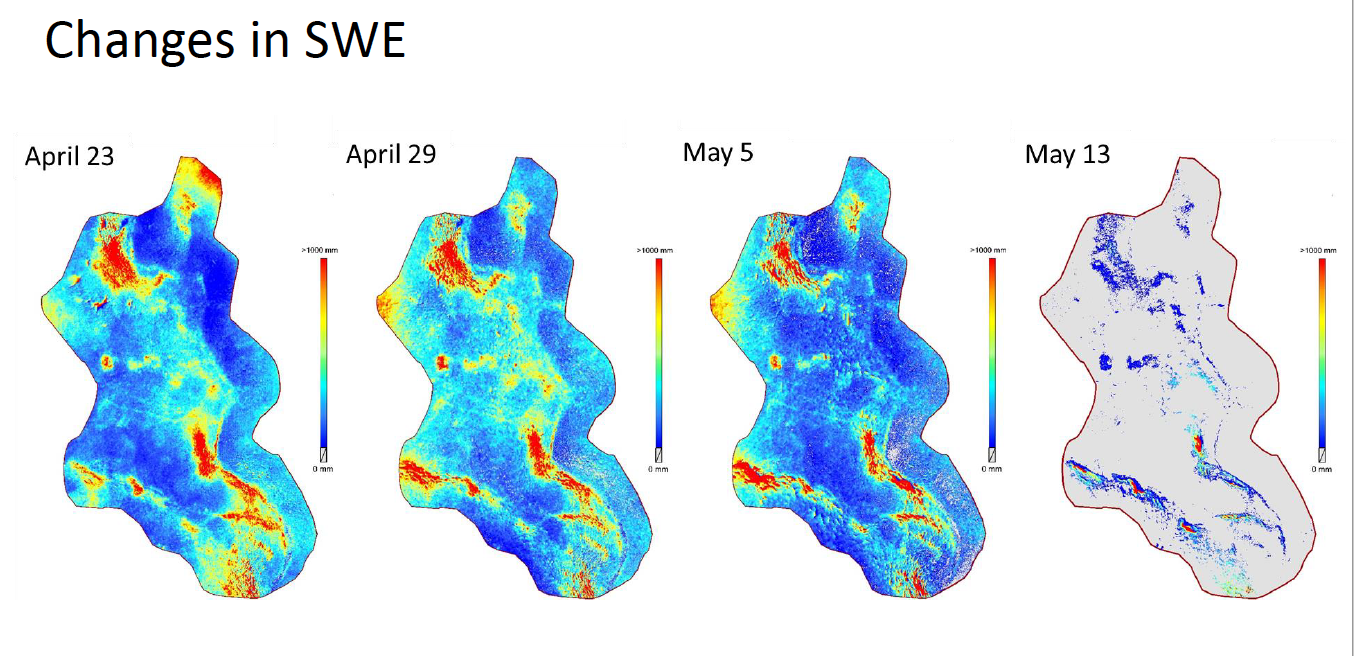
Figure 6.5: Visualization of change in snow water equivalent during melt of snowpack in Trail Valley Creek, NT., image source: Branden Walker. Used with permission.
This is how UAV-based mapping can be incorporated into a broader DE system, generating high resolution data over specific sites which can then be linked to both field level measurements (in-situ data) and more large scale earth observation data available from satellites. These three scales of geospatial data acquisition form a hierarchy that can be tailored to address specific environmental information needs and create the most accurate maps, models, and forecasting systems within an integrated DE system. Integration of geospatial data across spatial scales is a core research area for realizing the DE vision.
6.4 UAV Mapping Project Planning
While recreational drones are relatively common now with many amateurs using them for photography and just for fun, using a UAV for generating useful geospatial data requires a lot of equipment, preparations, and planning.
6.4.1 UAV Flight Planning
Flight planning requires several considerations about the study site, conditions, the actual flight plan, and logistical factors. Firstly, the study site should be clear of obstructions, traffic, buildings, etc. Except in rare circumstances where special permits are required, UAV mapping should not be attempted over large groups of people and/or populated areas. Depending on the platform, the take-off/landing area needs to be identified and ensured suitable.
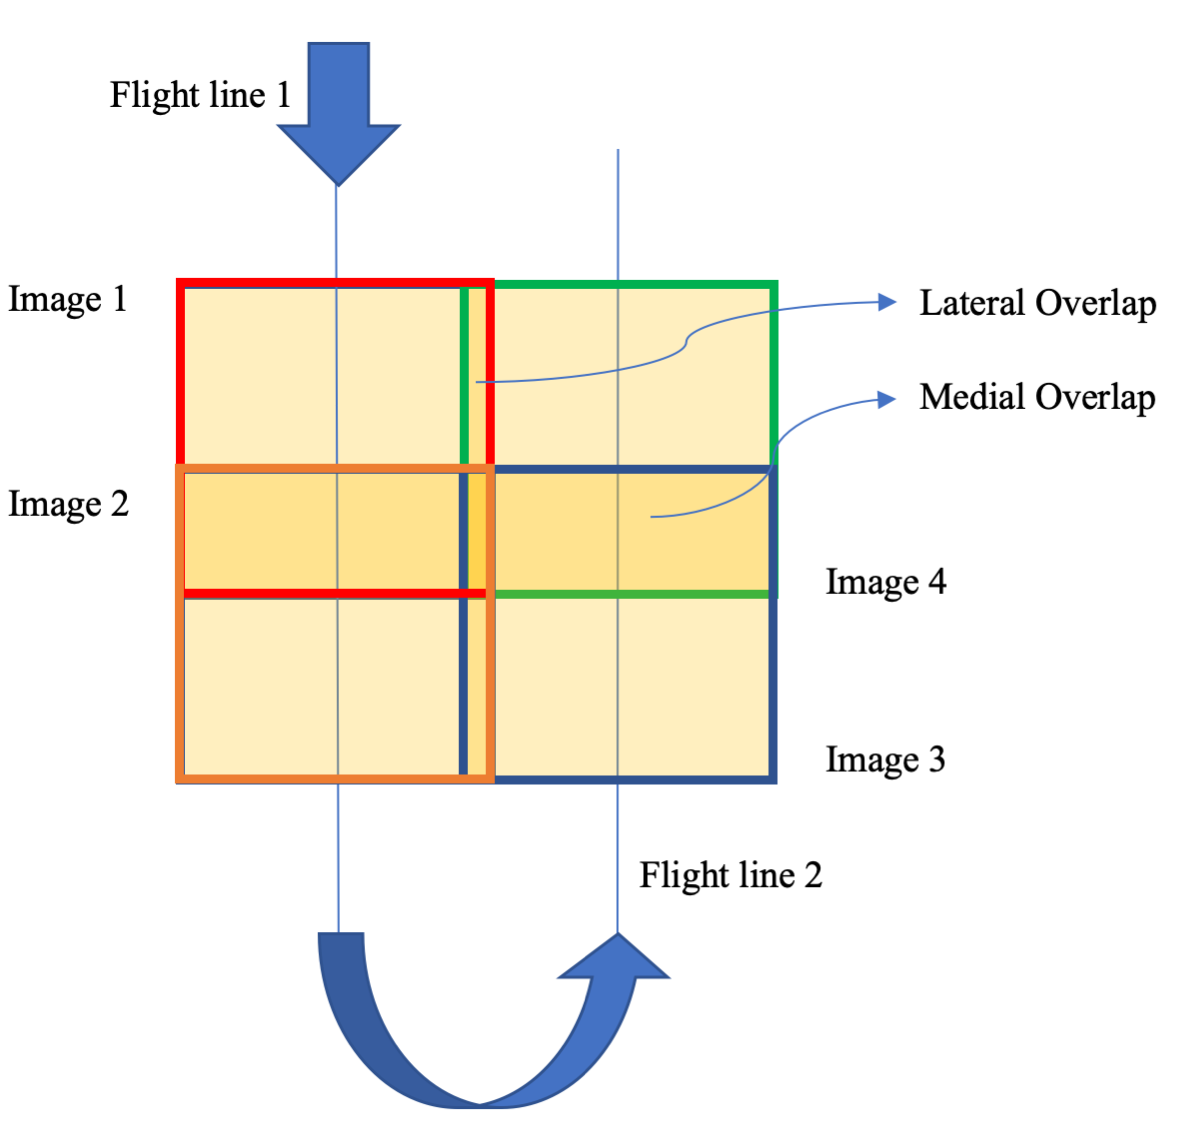
Figure 6.6: Basic schematic of flight line with lateral and medial overlap shown.
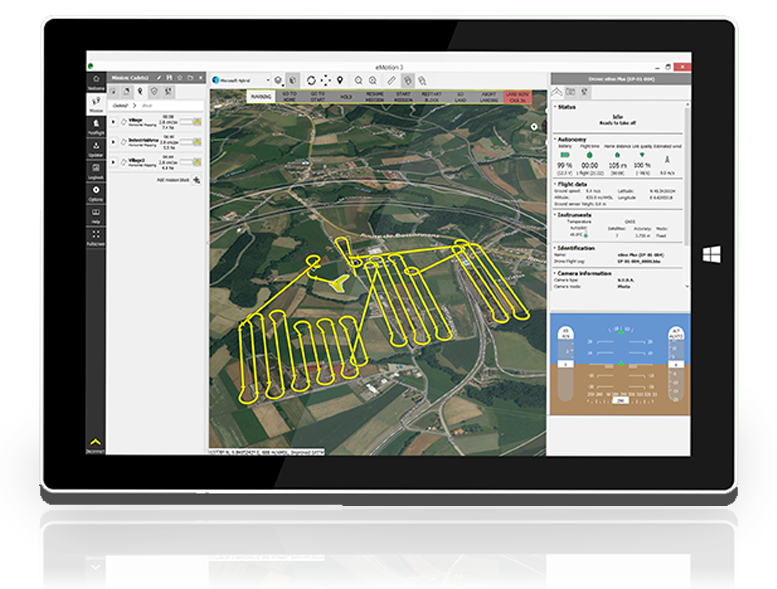
Any overhead obstructions (e.g., power lines) need to be identified and take account of. The flight altitude/ground resolution and the degree of lateral and medial overlap needs to be specified to ensure enough tie points for either 2D or 3D mapping. Finally the flight time of the planned mission needs to be considered; so that the battery life of the UAV is sufficient to complete the flight path. Flight planning software can be used to simplify these steps and ensure a successful mission.
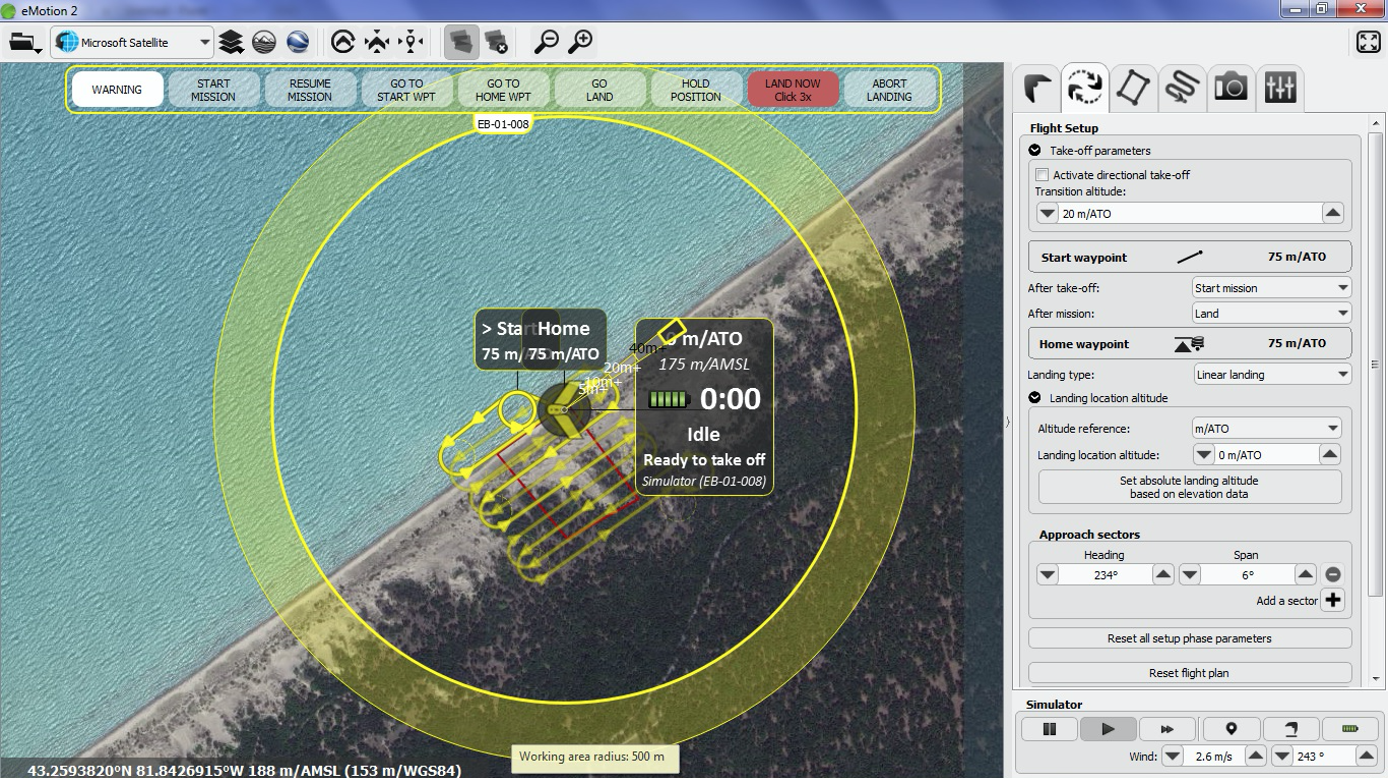
Figure 6.7: Flight planning software showing flight lines, take off and landing positions for mapping mission, image source: Alex MacLean. Used with permission.
6.5 Regulations for using UAV for mapping in Canada
Flying drones is heavily regulated in Canada. As of 2019 you now need a Drone Pilot Certificate to operate a drone that weighs 250 grams or more. 📖 Read through the regulations provided by the government of Canada. As well, take a look at the inforgraphic 📖 Where can you fly your drone?. One of the most important regulations is to NOT fly within 5.6 km of an aerodrome. It might be surprising but that regulation significantly limits where you can fly in populated areas. Have a look at a webmap that captures exclusion areas and areas of caution.
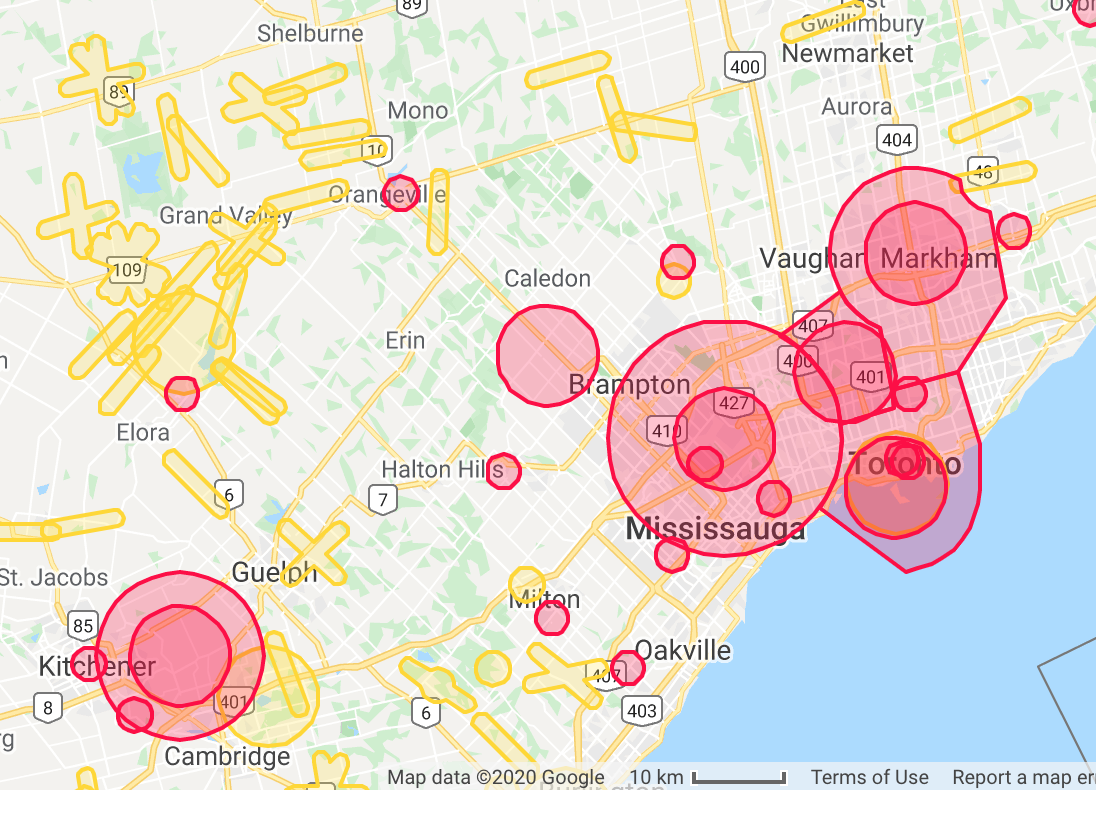
Figure 6.8: National Research Council of Canada Drone Mapping Tool, image source: https://nrc.canada.ca/en/drone-tool/
Stop and Do - 4
If you wanted to map your current residence would you be within an eligible zone? What would be some limitations you might incur if planning a UAV-based mapping mission over your current residence? What is the difference between orange filled areas and red filled areas on the map?
Now that you have a bit of understanding of how UAS work and can be used for geospatial mapping, 📖 read through the case study of using UAS for damage assessments.
6.6 Summary
In the last decade the use of drones and UAS for geospatial mapping has increased significantly. As a data source platform for the DE, UAV-based mapping can capture local scale landscapes at very high spatial resolution with a variety of sensors and platform configurations. This extreme flexibility coupled with the fact that deployment of mapping missions can be tailored to respond to unexpected events on an as-needed basis makes this mode of geospatial data capture very appealing. For these reasons we can only expect the trend of UAV-based mapping to increase.
6.6.1 Keywords
- UAS, UAV, drone
- VLOS flight
- structure from motion photogrammetry
- point cloud
- tie points