Module 2 The Digital Earth in Action
2.1 Preliminaries
2.1.1 Readings
Readings should be done when referenced during this week’s lesson. Do not read before starting the lesson.
2.1.2 Learning Objectives
By the end of this lesson, students will be able to:
- Explain how different geospatial datasets can be brought together around a common theme
- Distinguish single-purpose and multi-purpose geospatial data
- Find examples of geospatial applications
- Describe how issues of data quality and bias can impact geospatial data and applications
Activities for Module 2
- Readings
- Assignment A-M2
- Quiz Q-M2
2.2 The Digital Earth is Already Here
The Digital Earth is part of many aspects of everyday life. As illustrated in week 1, as more and more of our lives are digitized, more data is collected, stored, analyzed, and used to drive decision-making. You often hear ‘evidence-based’ or ‘data-driven’ which often mean some data has been collected and is being analyzed to reveal insights and inform policy, guidelines, or notions about how we should/can act in the world. This applies to our personal lives, as well as our interactions with and management of natural resources, wildlife, public services, and many other facets of life. The so called data-deluge has roots in almost all industries and sectors. As a result, ‘Data Scientists’ has been among the most rapidly growing job titles for the past several years.
2.2.1 COVID-19: Mapping the Pandemic
You are taking this course, either currently living through or having just experienced the greatest public health crisis the world has seen in over a century. COVID-19 is a truly global scale phenomena. A new virus emerges, has a unique combination of characteristics that make it spread easily. As it is new - no one has immunity, nor is there any baseline knowledge about risk factors, long-term impacts, etc. As such, the response to COVID-19 has been reactive and evolving, as more knowledge is generated about the characteristics of the virus and the disease it causes.
2.2.1.1 Maps and Disease
Mapping has been an integral part of studying epidemics throughout history. Because the trajectory of an infectious disease epidemic often depends on how humans interact, putting cases of disease on the map can provide insights into sites or mechanisms of transmission or sub-populations at greater risk. There is an entire field of geography and statistical analysis devoted to disease mapping, disease cluster detection and understanding of geospatial risk factors of health and disease. In the case of COVID-19, you have likely seen the dashboards that show cases such as the John Hopkins University COVID-19 Dashboard, or the Ontario COVID-19 Data Tool. These tools typically allow you to quickly see where cases are high or low and how they have evolved over time. As we all know firsthand, these sorts of tools become instrumental in the experience of the pandemic and impact behaviours, social dynamics, and ultimately disease transmission itself.
Consider something as simple as the case count, for example for Waterloo Region as of September 12 2020. According to official data, the total cumulative case count of COVID-19 cases for this data was 1518 positive cases. Try to think of some questions about the data-generating process that gave rise to this number.
What critical questions could you ask about these data?
Once you have a few questions click the button below.
Such questions underpin the linkage between the case count (i.e., the number in the data) and the true number of infections within the Region.
Too often when information is presented as data key questions about what processes actually led to the number in the data are absent.
In the early phase of the pandemic in the US, only those with travel history to Wuhan (i.e., the origin of the virus) or those who had come into contact with a known infected person qualified to be tested. This narrow definition had the effect of keeping the case count low and thus it could be said it was ‘under control’. Looking back we see the low counts were only because of the restrictive requirements for testing.
The key lesson here is to always scrutinize data, always be critical and ask questions about what decisions and processes went into creating the data - in short: what is the nature of the data generating process.
With that in mind - take a look at this geospatial visualization of COVID-19 which allows you to start and stop an animation of the global geographic spread.
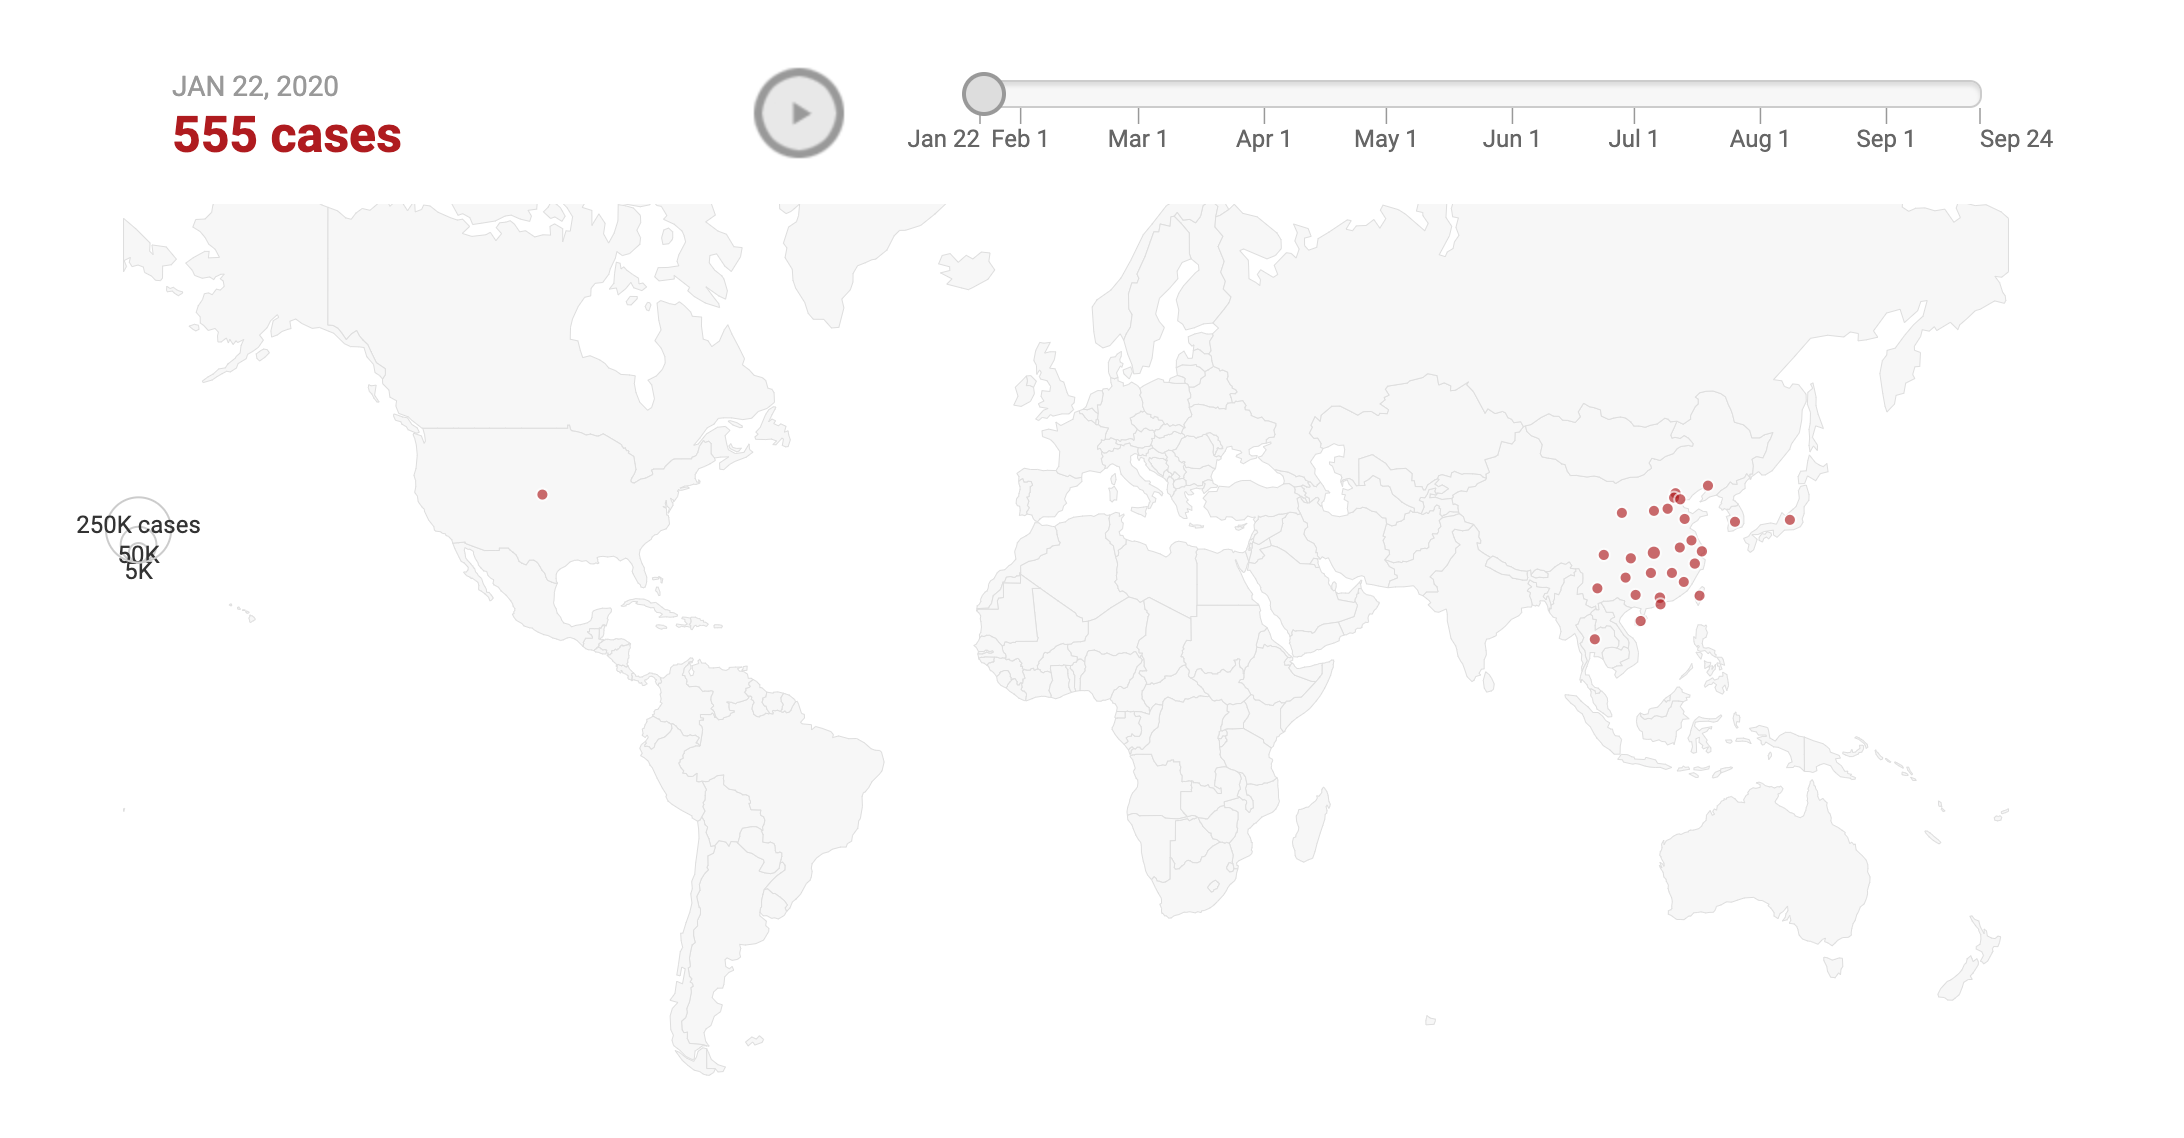
Figure 2.1: Visualization of spread of COVID-19, source: https://www.nbcnewyork.com/ Screenshot taken by Colin Robertson. Used with permission
Stop and Do - 1
Examine the geographic spread of the virus using the animation tool linked above. Think critically about what you are seeing. Write down three questions that you could ask to interrogate the data further.
2.3 Critically Thinking about Geospatial Data
Any kind of data that can be digitally represented as a geographic distribution (i.e., a map!) must be examined just as critically as the public health data examined above. Geospatial data are the data that underly maps, as well as a whole variety of software programs, apps, web services, etc. Just as we can ask critical questions of the COVID-19 data above, we need to ask questions about geospatial data.
Questions | Possible Answers |
How were the data collected? | Satellite sensor, digitized, copied from existing geospatial data, GPS, surveying, hand drawn |
Why was the data collected? For what purpose? | For regular monitoring, as part of a specific study, for commercial purposes, etc. |
Are the data 'open' [i.e., free and publicly available]- If not, why? | Yes, No, not sure, its commercial data, privacy reasons, etc. |
How were the data processed? | Converted from one format to another, reprojected to a different coordinate system, new derived attributes were computed |
Who is the audience for this map/visualization/application? | The general public, students, people using public transportation, senior citizens, the military, police forces |
How current are the data? | Today, last year, unknown, last updated June 1 2017, etc. |
What or who is misssing from the data? | People without a fixed address, people without cell phones, people that live in apartment complexes, rural areas, etc. |
Answering these types of questions takes time and effort. Sometimes geospatial data are purpose-built; meaning they are collected specifically for one purpose and are confined to use in that specific scope. This is what we can call single-purpose geospatial data. Consider for example, a property survey of a suburban house. This data could be stored as a vector geospatial dataset - essentially a collection of points, lines, and polygons encoded with geographic information and additional descriptive information. These data will typically serve no other purpose than to provide a digital record for where the property boundaries are located. However, increasingly, geospatial data are applied in a variety of uses. These multi-purpose geospatial data can serve a seemingly endless number of applications. Some forms of multi-purpose geospatial data play a role in a wide-number of use-cases, such as a digital elevation model (DEM) (which records elevation data) or a land-cover dataset which we saw in Module 1. These data are multi-purpose because they serve as basemap data and many other applications depend on them. For example, DEM data might be used to detect areas at risk of avalanche, to describe the habitat charcteristics where observations of an endangered species have been made, or in evaluating locations suitable for a new industrial facility. Other examples of basemap geospatial data include roads, water bodies, building footprints, and aerial imagery.
Stop and Think - 1
Basemap geospatial data is crucially important to the Digital Earth as these datasets fuel many applications and services. However, there is no agreed-upon standard or source for these essential datasets, rather they are produced by all levels of government, at different levels of detail, using different methods and coordinate systems, and have widely varying degrees of access (i.e., free and open source to commercial data costing thousands of dollars). Think about why this could cause some problems. Understanding how to access, evaluate, and integrate appropriate basemap data is a key skill!
Another form of multi-purpose geospatial data is an emerging type of data that are used for completely different purposes than it was collected for. This type of data is more common in what is typically referred to as Big Data. The term Big Data - which we will explore in depth in a later week - is often desribed in terms of the ‘three v’s’ - volume, variety, and velocity. Essentially; data that is large in size relative to standard data storage and processing tools, data that are produced in a wide variety of formats and representations (e.g., tabular, image, free-text, video, etc.), and data that are rapidly updated and continuously being collected. To understand how big data intersects with multi-purpose geospatial data we can consider an example; that of mapping the global distribution of ships at sea.
2.4 Big Data Example: Mapping Global Shipping Patterns
](images/shio.png)
Figure 2.2: Ship at sea. Image source: Marco Verch
Ships at sea need to communicate with each other, and a system called the Automatic Identification System (AIS) was developed in the 1990s as a way for ships to communicate critical information such as their ship’s identifier, geographic location, speed, and intendend route. Transceivers placed on board ships could communicate this data to other nearby ships (i.e. ship-to-ship) via on-board transceivers or to land-based transceivers (i.e., ship-to-shore). The primary use of AIS in its initial phase was navigation, collision avoidance, and aid in navigation - as an add-on to existing on-board radar. At some point in the mid-2000s it was realized that the AIS signals could be detected from space-borne sensors on satellites. This has led to the growth of a constellation of satellite-AIS (S-AIS) sensors that detect AIS messages and thereby giving an indication of ship location and related metadata. Scaled globally, this means it may be possible to map ship location in real-time for the entire earth; this is an example of big geospatial data.
One of the leading companies in S-AIS, Exact Earth Corp. is actually based in Waterloo Region. See how they market their S-AIS data and how it relates to different geospatial applications in the short video below. Pay attention to what problems and/or issues this one global geospatial dataset is being applied to.
One of the often-touted benefits of big data is its potential for hidden insights into processes which would otherwise go unknown. The story of S-AIS and evolution of global-scale ship monitoring from space is a perfect example of new use-cases can emerge from big data. For example, researchers have used S-AIS data to detect illegal fishing and as part of maritime surveillance for piracy.
There are many secondary web applications that make use of A-AIS data, for example Marinetraffic.com. Explore the web-map here.
- Click on a few ships and explore the rich attributes that are tracked for each vessel.
- Try click on the Past Track button of a vessel to see where it has been.
- Explore some of the options in the user interface.
Gaining this synoptic scale view of marine vessels has many benefits and uses, as noted in the Exact Earth video above. Seeing the data in map form also tends to lead to questions about spatial distribution:
Why are there lots of points here and none there? Do bulk carriers use the same routes as non-commercial ships? * What regions have higher risks of collisions, etc.
These questions can be answered through the techniques of spatial analysis.
Stop and Do - 2
Take some time to explore the marinetraffic.com website which also includes rich data on ports, ships, shipping lanes, and other related factors. Some of these data are contributed by users (i.e., crowdsourced) while others are culled from other existing datasets. This represents a great example of a Digital Earth application, utizliing extensive geospatial data around a common theme. Write down one way these different types of data could be used together to help solve a problem or answer a question.
Take some time to explore the marinetraffic.com website which also includes rich data on ports, ships, shipping lanes, and other related factors. Some of these data are contributed by users (i.e., crowdsourced) while others are culled from other existing datasets. This represents a great example of a Digital Earth application, utizliing extensive geospatial data around a common theme.
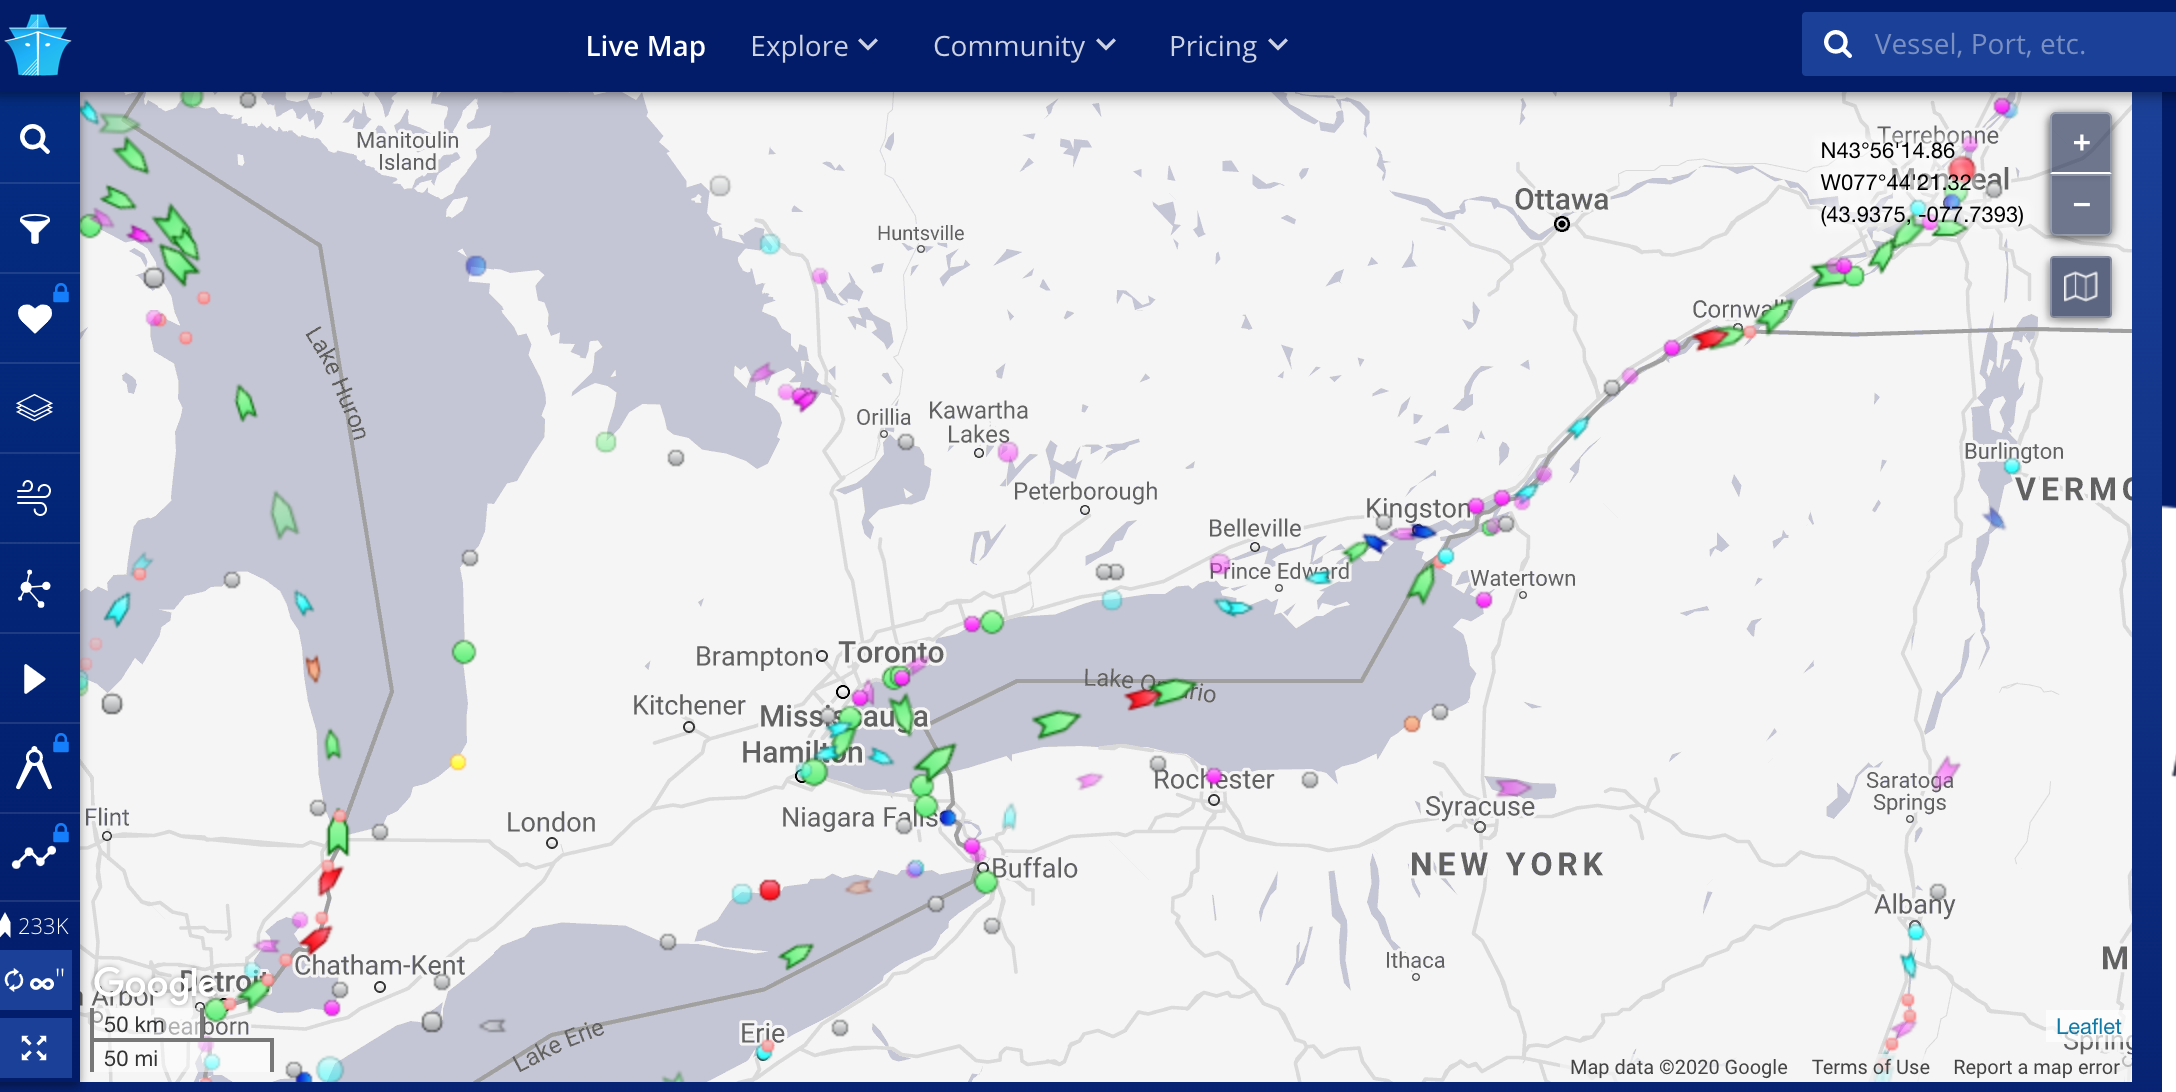
Figure 2.3: Screenshot of webmap at global ship tracking website, source: https://www.marinetraffic.com/
However, as we noted earlier it is also important to apply a critical lens to the claims made by such data vendors. We can now ask some of the key questions noted above to this S-AIS global dataset:
Questions | Possible Answers |
How were the data collected? | Satellite-borne sensor picking up AIS messages transmitted from ships at sea |
Why was the data collected? For what purpose? | The AIS messages exist primarily for navigation purposes |
Are the data 'open' [i.e., free and publicly available]- if not, why? | These are commercial data, viewable publicly but must be purchased to access the data |
How were the data processed? | S-AIS data go through a series of data processing steps. The messages are located within general regions of the earth where the messages from many ships might be simultaneously detected. S-AIS system has to organize messages in order and transmit the message data (as 256 bit slots) down to a base station where it can be decoded and reformatted as tabular data. The exact details for how message data are processed are commercial proprietary information. |
Who is the audience for this map/visualization/application? | Answer in your notebook |
How current are the data? | Answer in your notebook |
What or who could be missing from the data? | Answer in your notebook |
2.5 Weather Prediction in the Digital Earth Era
Weather prediction is perhaps the most fundamental, immediately useful application of the Digital Earth. We depend on weather apps on our phones, on the Internet, and in the media to help plan our days and weeks. These are vital sources of information for everday life, as well as for critical industries like agriculture.
What our simple apps and websites hide is the fact that weather forecasts are the outputs of complex computer models of atmospheric processes. Inherent in weather forecasts are questions of scale. When we talk about scale in geography or environmental studies, we typically mean the level at which a process is operating.
Common scales might be generic terms like local, regional and global. In geospatial and Digital Earth applications, scale is typically described in terms of spatial grain, or the smallest size object that can be resolved by a sensor. For example, a sensor that can measure up to a 5 m road width in a single pixel would have a nominal spatial resolution of 5 m. We can also categorize spatial grain size in terms of resolutions: low resolution, medium resolution, high resolution which map onto linear dimensions of pixel sizes in geospatial data, such as 25 km, 1 km, and 10 m respectively.
Weather forecasts are the result of computer models which combine physical models of ocean and atmosphere processes into different iterations of possible weather, in order to generate scenarios extending into the future for a desired amount of time. As we all know, the 1-3 day forecast is generally more accurate than the 16-day forecast, as there is less uncertainty the shorter the forecast period is.
To highlight just how much work goes into our daily forecast - we can briefly review the Global Ensemble Prediction System, which encapsulates physical processes in the ocean and atmosphere variables such as temperature, precipitation, cloud cover, wind speed and direction, and humidity up to 16 days into the future. These processes are modelled on a global grid with a resolution of 0.35 degree (roughly 39 km at Equator). This means each pixel or grid cell covers an area roughly 40 km x 40 km - a fairly large area. This also means that any weather variability within that 40 km x 40 km grid cell footprint is lost. This system include geospatial data on sea ice, sea surface temperature, surface and deep soil temperature and moisture, snow depth, snow albedo and snow density, and many other related physical variables. These models are extremely complex, combining surface observations with models of physical processes and their uncertainties. Each dataset within these systems can be thought of as a hidden layer of the Digital Earth, working in the background to combine with other datasets and models to produce the weather forecasts we use everyday. We can take a deeper look at the data used by Environment Canada on their Open Data site.
Stop and Do - 3
Read through one of the tutorials showing how to work with the Environment Canada in the open source GIS software package QIS. This shows how you can actually work with geospatial data to answer new questions - rather than just looking at pre-generated results.
What is meant by the term in situ observations?
OPTIONAL: If you are up for it, try downloading and installing QGIS and try to run through the tutorial.
2.6 The Digital Earth Basemaps - Resources to Explore
Have a look at the following Digital Earth geospatial datasets. As you explore, try to think about what these might be used for, how the data is measured, and potential issues or sources of bias in using them for particular purposes.
2.6.1 Terrestrial Water Storage
NASA Gravity Recovery and Climate Experiment (GRACE) Data Analysis Tool (DAT)
Stop and Do - 4
📖 Read a related paper using the GRACE TWS data.
What is happening in Figure 1? What happened in Texas in 2011? How was this detected?
2.6.2 Snow
GlobeSnow project for snow-water equivalent (i.e., volume of water stored in the snowpack)
2.6.3 Human Settlements
2.6.4 Disease Outbreaks
2.7 Summary
Our goal this week was to explore how the Digital Earth and its related tools and technologies are being used today. We have seen that in everything from weather forecasting to global ship monitoring, digital representations of how natural and social processes are distributed geographically are critical. We have also highlighted how the same geospatial datasets can be reused for a wide variety of practical applications. A digital elevation model for example, can be used for many different studies and applications because surface elevation is such an important component of many different fields.
We have also reviewed how we can ask critical questions of Digital Earth data, and to understand that behind simple outputs might be many different models and datasets with their own biases, subjective decisions, and data quality limitations. As such, to become critical consumers of the Digital Earth, we need to ask questions about data source, processing, scale, why data were created, and how current data are.
Geospatial data can create compelling visualizations and tools that allow you to explore the Digital Earth (e.g., marine traffic providing a digital window into global shipping); but this can also obscure what is missing or mis-represented. But the Digital Earth is more than digital geospatial data, it is the tying together of data and applications into a comprehensive earth system; capable of answering questions about the current, past, and future states of earth’s ecosystems, atmoshphere, oceans, and people. We are only at the beginning of realizing this Digital Earth vision.
2.7.1 Key Terms
- data generating process
- single-purpose geospatial data
- multi-purpose geospatial data
- basemap geospatial data
- digital elevation model
- big data
- scale
- in-situ observations