Module 1 Introduction to the Digital Earth
1.1 Preliminaries
1.1.1 Readings
Readings should be done when referenced during this week’s lesson. Do not read before starting the lesson.
1.1.2 Learning Objectives
By the end of this lesson, students will be able to:
- Cite several examples of how geospatial data are used in everyday life
- Explain the concept of the digital earth
- Provide an overview of how the world is represented in digital tools
- Describe what it means for data to be considered geospatial
Activities for Module 1
- Readings
- Assignment A-M1
1.2 Digital Earth Today
When you think about the big environmental issues our time: climate change, loss of biodiversity, deforestation, we often think of vivid visual imagery, of polar bears on ice drifts, or recently harvested tracts of Amazon forest. Rarely do we think of the following image:
Figure 1.1: A possible digital earth, vegetation anomalies as sensed by satellite sensors, visualization credit: B. W. Lewis
Yet most research, management, and decision-making around these big problems rely on digital representations of the environment. In this course we explore how the concept of the digital earth is shaping how we come to understand and solve these critical issues.
The world is rapidly changing. When we consider how we have used maps and mapping in the past to record locations, routes, forest boundaries, roads, etc. we tended to depend on static versions of the world; singular snapshots in time captured on a paper map, or later, on digital version of a paper map. However this situation has changed dramatically. Almost every aspects of our lives are mediated through some digital technologies, and often these are encoded with some geographic details about the location where things occur. Images and videos are increasingly obtained from drones, satellites, and mobile phones.
Consider a typical day for a university student in Canada, and the digital representation of this day.
Activity | Digital |
Wake up | Phone records first time you check your messages, has location reference connected with Wifi router at home |
Catch the bus to school | Swiping bus pass records your ID and bus stop location and time you board |
Attend classes | Using student card and payment card records time and location of various activities throughout the day, connecting to different Wifi spots as you move about campus records location |
Meet friends for coffee | Using bank card for purchase records time and location |
Go to volleyball practice | Cell phone pings of towers recording approximate location as you move around the city |
Go home | Netflix connection records device ID and time you log on |
All day long | Satellite imaging of locations you are at various resolutions, CCTV cameras capturing images and video, other people capturing you in photos and video |
The number of digital interactions we engage in increases as more and more of our lives are mediated through digital devices networked through the Internet. An increasing share of these interactions include some level of geographic information about where on the earth they occur. So much data is being generated about the earth and what we do in it, the idea of the digital earth has been increasing in popularity.
While we can immediately see how our digital lives can be encoded to digital data, it is perhaps less obvious how our understanding of the environment is dependent on geospatial technologies and the digital earth. Climate change, extreme weather, flood forecasting and flood mapping, and more mundane activities such as management of streetlights, land parcel boundaries, and road construction all rely on an accurate digital record. The key defining feature about this type of digital record, often called geospatial data, is that the data knows where it is, relative to other things. For example, a digital record of a new road, needs to also know about the slope and elevation, subsurface materials, existence of other connecting roads, land parcel boundaries, right-of-ways, etc. And each of these also needs to be aware of their relationship to many other features and characteristics of the world we live in.
The way that geospatial data accomplishes this spatial awareness is by referencing location relative to the entire earth using a coordinate system. All we need to know about coordinate systems right now is that they are a way of marking position in space, and they can be tied to the surface of the earth, so that positions on the earth can be located accurately. We therefore need a model for the earth upon which to construct a coordinate system. There are many models of the earth and ways to create coordinate systems, but in order for data to be considered geospatial, they must be encoded with this special information that allows it to be accurately located on the earth.
Read about what geospatial data is here1.3 What is the Digital Earth
The term ‘Digital Earth’ was coined by US Vice President Al Gore in 1998 in an address at the California Science Center. You can read the full text of his speech here. The vision lays out an ambitious idea to create a 3D version of the planet that has historical and real time data on weather, traffic, crime, housing and a limitless array of other characteristics. You may be thinking that this sounds a bit like Google Earth; and indeed the first version of Google Earth was released just a few years after this call to action. Although this vision for a Digital Earth was laid out over 20 years ago; the key points remain important today, a Digital Earth must have
- an explorable interface for navigating the earth
- geospatial data from a vast array of sources
Google Earth is a great introduction to the Digital Earth. Here is a short clip (0:06) showing an urban environment. Think about how the buildings, roads and trees in this clip are digital versions of the real objects. Sometimes each building or tree is stored as an object with its own information, while other times they are encoded as pixels within a image. The way that real world objects and phenomena are stored in their digital forms has a big impact on how you can use them.
Compare navigation in Google Earth shown above to the Urban Observatory web application which you can explore here. The Urban Observatory allows you to compare different ‘themes’ across three cities simultaneously. This is much closer to the ideas outlined in Al Gore’s 1998 address.
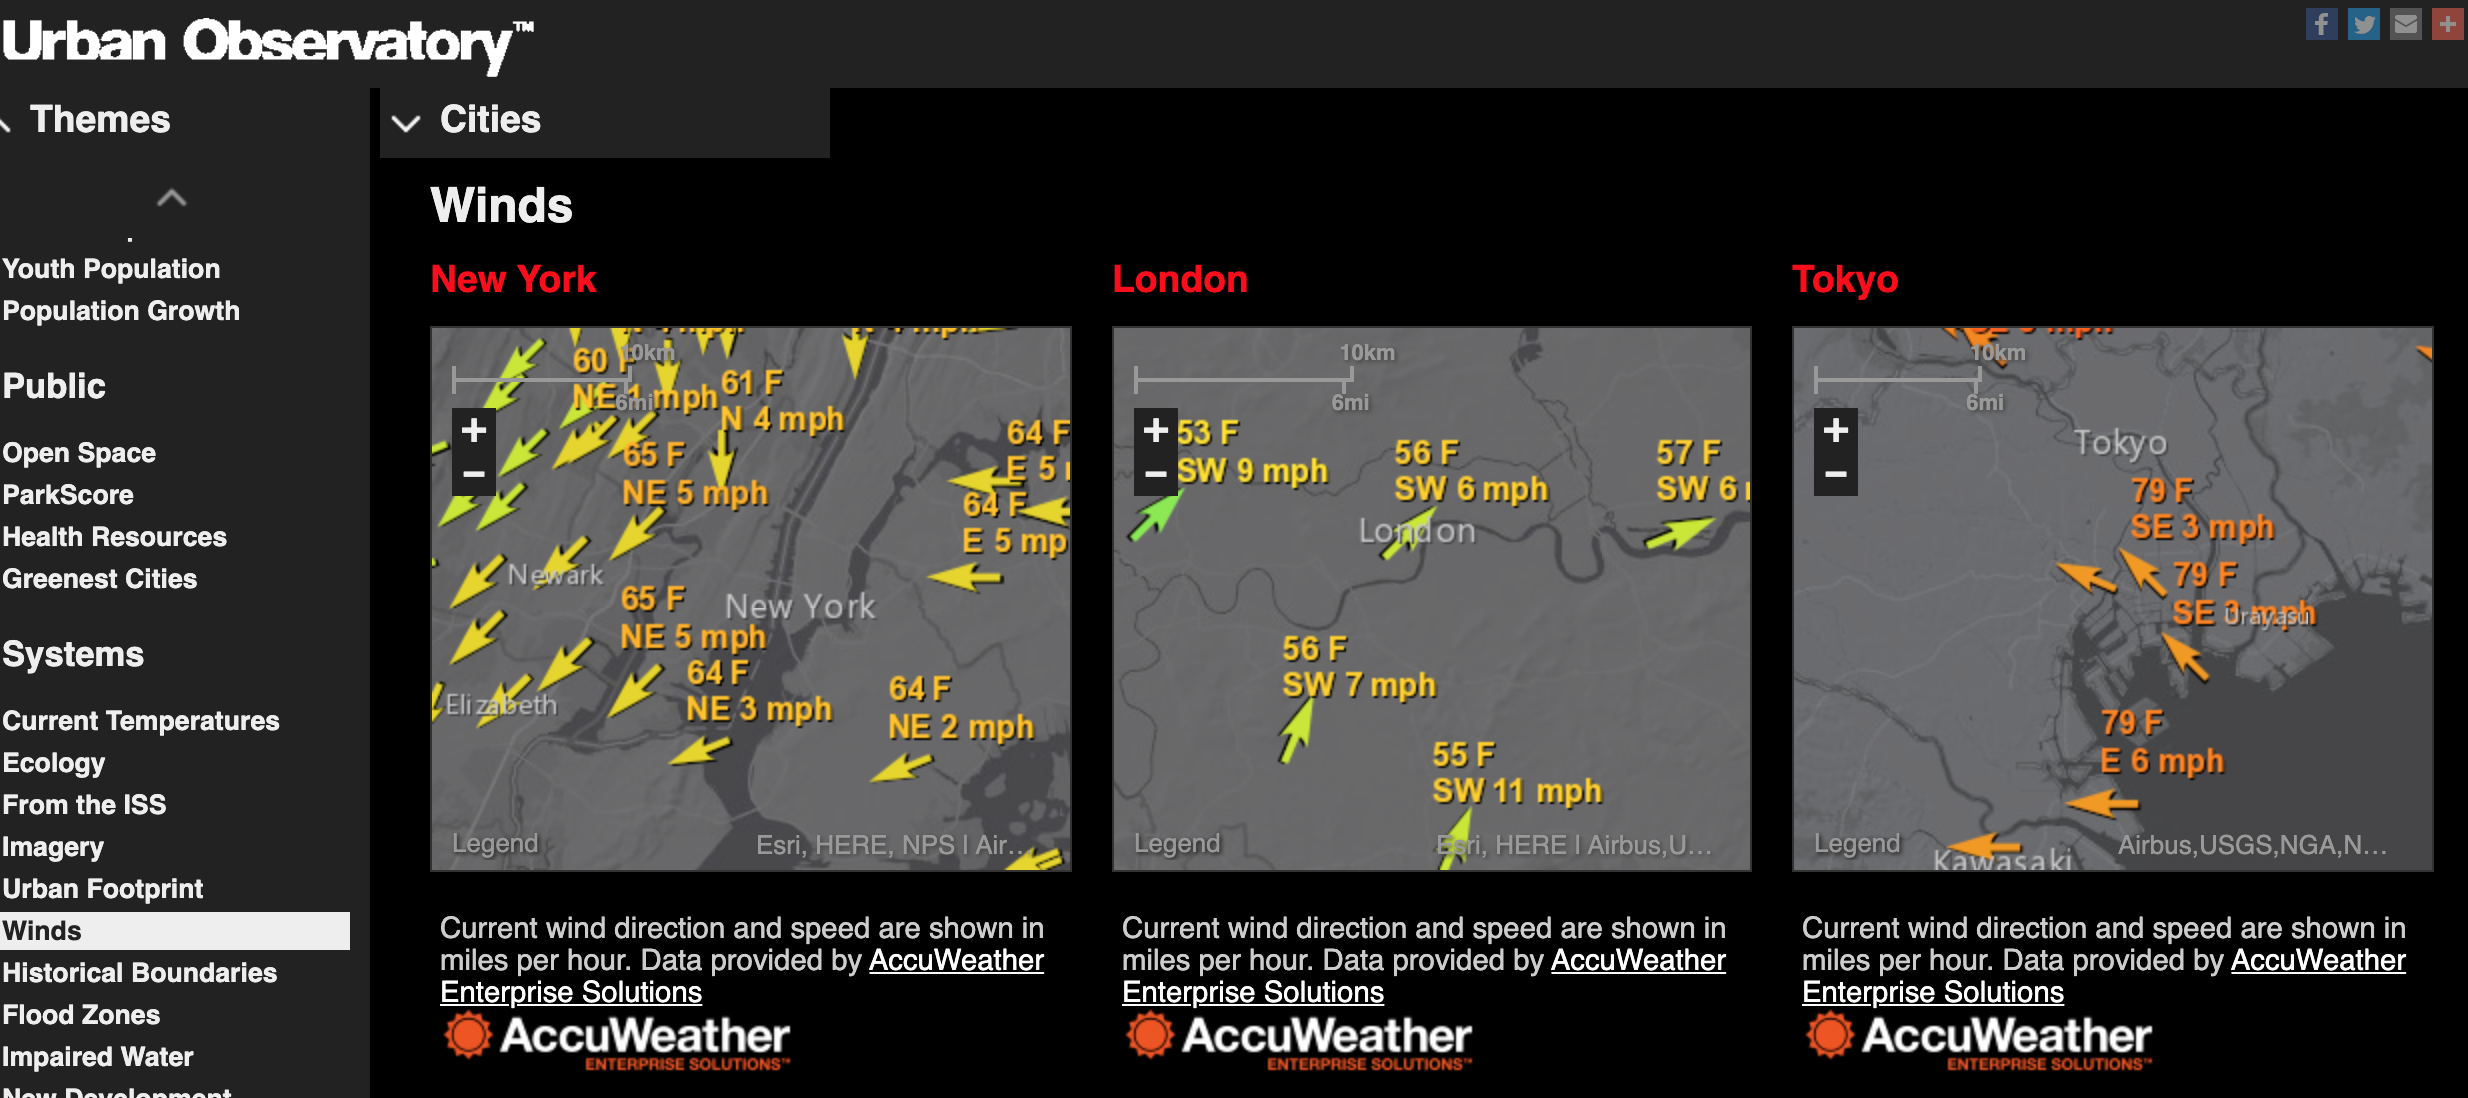
Figure 1.2: Comparing real time wind data between New York, Tokyo, and London with the Urban Observatory. Screenshot taken by Colin Robertson. Used with permission
Stop and Do - 1
Try comparing the Housing Density theme across New York, Tokyo, and London.
- What patterns do you see?
- What questions does seeing the geospatial data displayed in this way evoke?
Spend some more time exploring the Urban Observatory application to get a feel for viewing and comparing patterns in geospatial data. These are key skills for working with Digital Earth tools.
The Digital Earth vision articulated in 1998 was not the result of a new invention. Rather, the idea was based on the maturing of several technologies that had been (and continue to be) developed and increasing in power and capability. We will briefly define some of the core building blocks on the Digital Earth:
- Geographic Information Systems (aka GIS) - can be defined as an information system tasked with representing geographic objects, relationships, and processes (from ???)
- Satellite-based Earth Observation (a form of Remote Sensing) - has been increasing for the past 50 years, and we now have a rich archive of satellite images capturing changes to earth’s environment at a variety of spatial and temporal scales. Satellite imaging provides much of the data needed for the Digital Earth vision to be realized. 📖 Read more about satellite-based earth observation in this article in Scientific American
- Global Navigation Satellite Systems (aka GNSS, of which GPS is one type) - these are satellite-based systems which - among other things - allow positioning information on earth to be determined based on a receivers distance from several satellites it connects to. Originally developed as a military technology by the US Government, GNSS and the most widely used variant the Global Positioning System (GPS) is now vital to everything from getting directions on your smart phone to mapping polar bear sightings. Read more about GPS and GNSS here
- Geographic Information Science (aka GIScience) - you may be thinking this sounds a lot like #1 above, and it is. However the field of GIScience has built up over the past four decades to provide a theoretical basis for the tools and technologies noted above. A good way to distinguish GIS from GIScience, is that if it is about a software tool it is GIS, and if it is about a concept, theory, or more generic methodology, it can be described as GIScience. This distinction in nomenclature is not super important, but serves to highlight that there is a deeper body of work supporting the development of the Digital Earth, and one which continues to be developed by scholars in a wide range of disciplines.
Many other fields also play important roles in building the Digital Earth: geodesy, surveying, cartography among others; and many other areas of social and natural science provide the application contexts which drive the development of tools and technologies further. Classic users of these tools have come from forestry, agriculture, landuse planning, mining, conservation, and transportation. You may notice a similarity here; fields focused on land-based issues are highly dependent on geospatial data and the technologies that make use of geospatial data.
1.4 From the Physical to the Digital Earth
A key thing to remember is that geospatial data in the Digital Earth and the actual variables and processes those data represent are different. The wind data shown in Figure above is wind as recorded on a specific date and time. As well, the wind is measured using an anemometer at a weather station, which are located at specific locations. Often, multiple measurements from different weather stations are combined to generate maps of the dominant wind direction and speeds. However - since the actual measurements are only made at the stations, everywhere else is an estimate, which may ignore how wind interacts with the terrain, buildings, etc., and thus is likely not accurate everwhere.
A key aspect of working with geospatial data is to learning to ask the right questions:
- where the data comes from,
- how accurate it is,
- how it changes over time,
- and where and why it might misrepresent reality.
As we will see this is especially important when working with datasets describing human dimensions and societal conditions.
1.5 Themes, Layers, and Abstractions of Reality
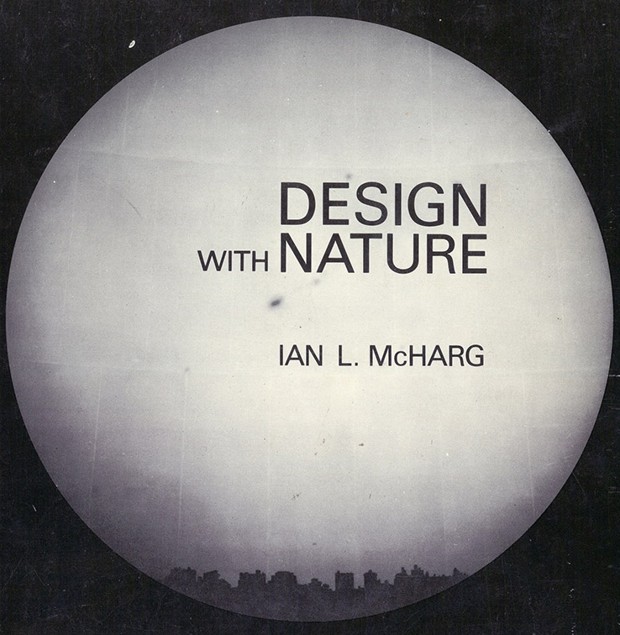
In the Urban Observatory application noted above, a key idea is the representation of features and characteristics of the environment as layers that can be toggled on and off. This idea has its roots in actual layers of acetate, whereby different types of information: rivers, contours, cabins, hiking trails, etc. were mapped on separate plastic sheets which could then be viewed on a light table, and removed or added as needed. This gave much more flexibility in seeing how features related to each other. The layering of spatial datasets as a basis for landuse and environmental planning was also a key aspect of landscape architect Ian McHarg’s Design with Nature book which has been hugely influential in city and environmental planning since its publication in 1969. Watch the following short clip (~3 mins) from long ago describing the Canadian Geographic Information System which is often cited as the first GIS ever created - a system designed to manage the large land resources of Canada.
You can see from the above, that having to deal with transparancies with maps printed on them would not be an efficient way to manage information about the environment, even in the 1960s. GIS technology was created to use the power of computers to solve this big data problem. In GIS today, as shown in the Urban Observatory above, the idea of thematic layers remains a very important idea. Actually, as we will see - a variety of non-digital map-based ideas were simply made into digital equivalents. Even the latest GIS technologies and mapping tools make use of layers, coordinate systems, datums, and others concepts and ideas that have been around for hundreds of years.
1.5.1 Abstractions of Space
Thematic layers of geospatial data represent the geographic distribution of a single type of phenomena, in addition to potentially many other descriptive attributes of that phenomena. There are two fundamental ways layers capture information about a characteristic in the environment we want to represent in the Digital Earth:
- as a discrete object using something called the object data model,
- or as a continuously varying function of space, using something called the field data model.
We will get into these data models in more detail later, but intuitively we can think of how we might map different types of phenomena. If we wanted to record locations of where bicycle accidents occured in our city, we would probably want to use the specific location - represented as a point on a map. This is exactly what you can do in the BikeMaps.org citizen science project, which uses web-based mapping to record and display bike collisions, thefts, hazards, and near-misses.
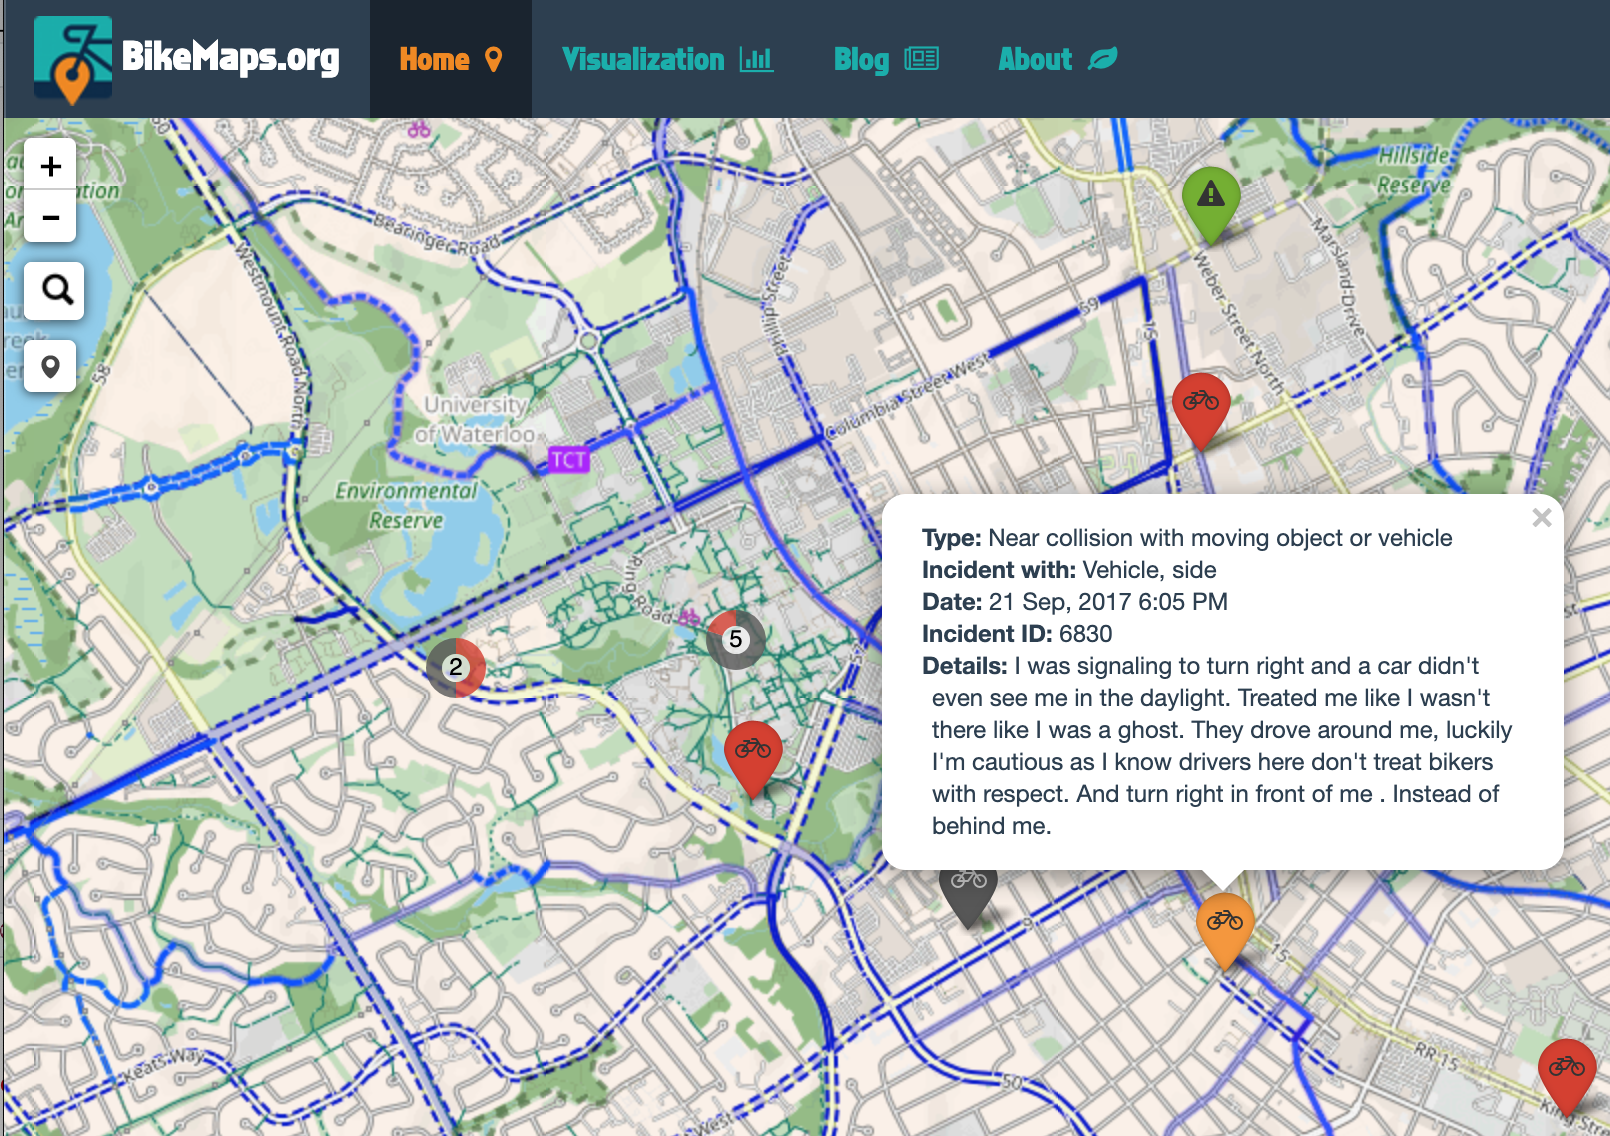
Figure 1.3: Citizen science project Bike Maps uses web-mapping and geospatial data to track bicycle collisions, near misses, and thefts in cities across the world. Here the orange pin has been clicked to explore more attribute information about the near-miss event.
Take some time to explore the BikeMaps site and see how it works, if you ride a bike and have a collision or near-miss to report, make a submission! These sorts of online tools get their power by the collective contributions from people just like you (citizen science!) and can lead to insights not otherwise possible. Notice that when you click on a pin, extra information about that event comes up (these are called ‘attributes’ in GIS terminology).
Bicycle collisions lend themselves very well to a point-based representation on a map; the happen at specific locations, at specific points in time. You can imagine that by mapping these events over time for a given city (as BikeMaps is aiming to do across the world), you get a sense of which intersections have a higher risk of collision, and steps can be taken to improve safety at these locations. This is the sort of spatial pattern analysis that can really only be done through the collection and analysis of geospatial data. We might also want to know the cause of an area of high risk; for example whether its due to heavy road traffic, or the physical design/visibility of the bikelane, or a host of other possible explanations. Now if these factors were also geospatial, we could evaluate which cause is most likely, and then confirm this through investigating more details of reported collisions, and ultimately come up with a solution to reduce the number of collisions by modifying the environment.
The second data model for representing data as geospatial, is called the field data model, and this is for phenomena that varies continuously across space. What does this mean exactly? It’s best to think of some examples: air temperature, surface elevation, landcover; each of these is something that can be measured anywhere on earth. If we wanted to map waterloo air temperature, we could have an infinite number of points. Sine this is not possible, the most common was to represent this type of continuous spatial phenomena is as a grid of pixel elements, otherwise known as pixels. Each pixel knows its location on the earth, and the value attached to each pixel is a measurement of the phenomena of interest (e.g., temperature). Landcover mapping is another example; whereby any location can be ascribed a landcover class, such as forest, urban, agriculture, etc. Here is an example of a landcover map for all of Canada.
Stop and Do - 2
Take some time to explore panning and zooming around this webmap.
To really understand what we’re seeing here, we would need to look at the map legend that associates the colour of each pixel to a specific landcover class. However, we might be able to figure out what some colours are. For example, can you figure out what the light brown colour represents? What about red?
Note also that when we click on this map, we do not get any extra information. Each pixel only knows what its landcover is - nothing more. This landcover map is the result of a classification of satellite imagery. Since this is a mostly automated process, it can be replicated each year, and in this way can track the loss or gain of specific landcover types. Think about how or why this might be useful.
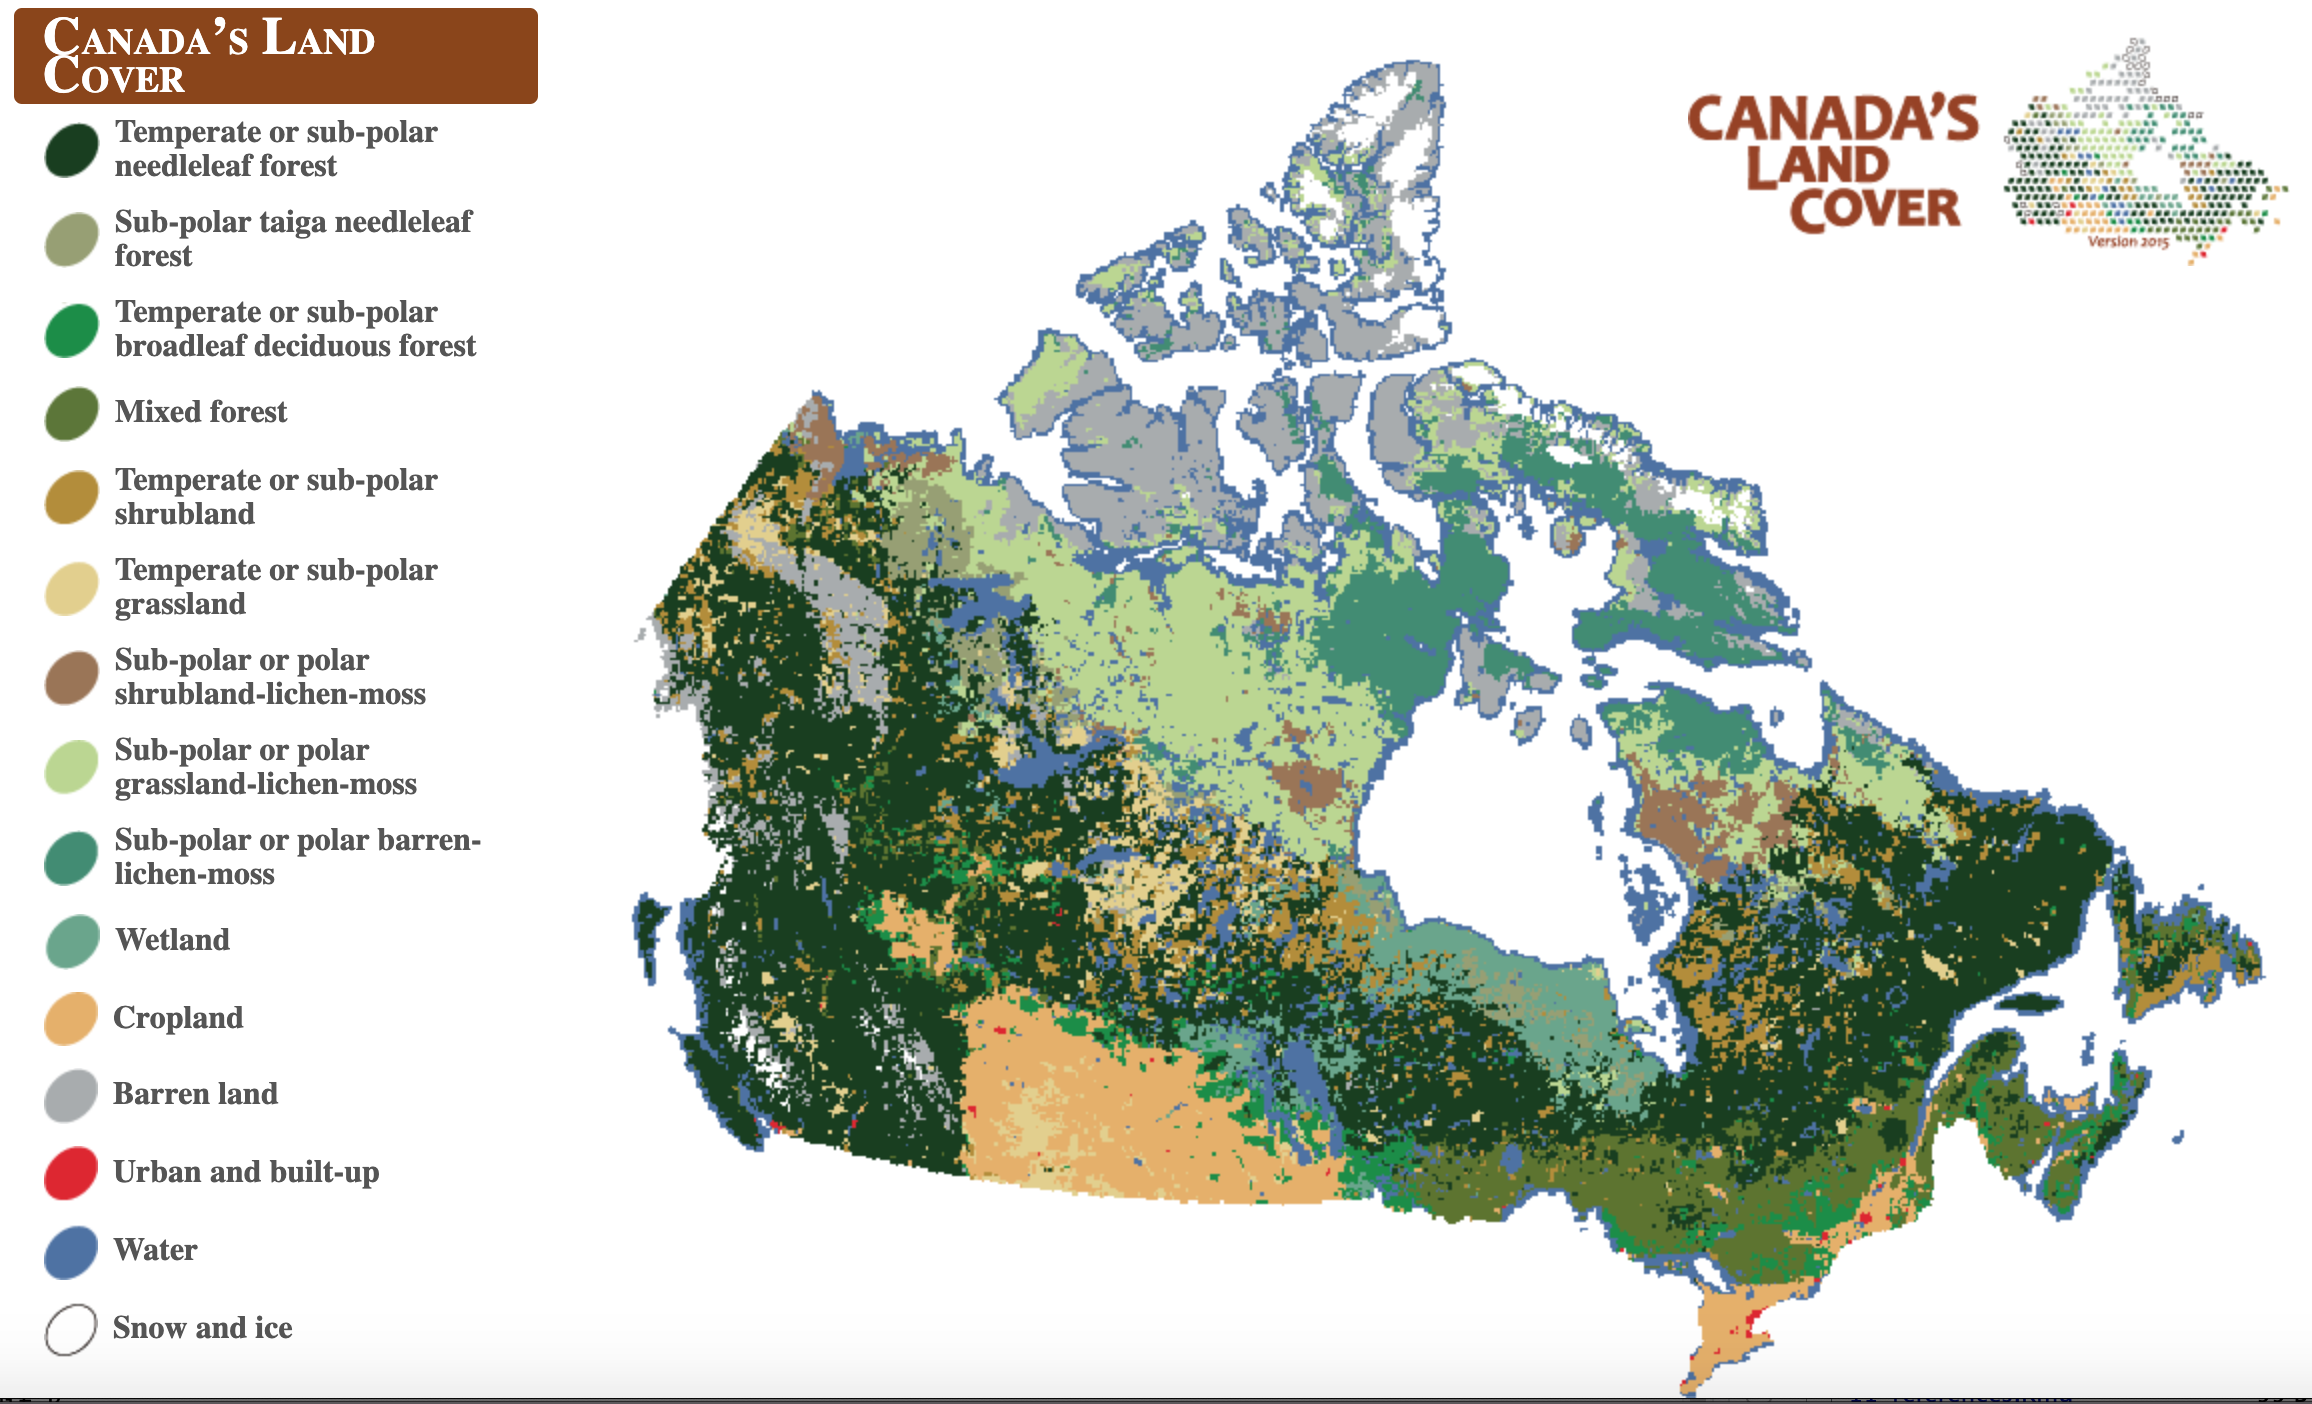
Figure 1.4: Canada landcover map, 2015, derived from satellite imagery. Source: Natural Resources Canada. Screenshot taken by Colin Robertson. Used with permission.
Now, take some time to read about how this geospatial data was created and what the colours mean. This is a very important geospatial dataset that can serve a wide variety of applications. When we examine a landcover map like this we get information about the relative abundance of different classes, as well as where they are located in relation to each other. For example, in northern Canada we can see where the forest classes change to tundra classes (i.e., Sub-polar or polar grassland lichen-moss) - a region otherwise known as the treeline.
1.6 The Digital Earth Career Path
As the Digital Earth includes a wide variety of tools, datasets, and fields where it can be applied, there are a number of career paths related to the Digital Earth. Classic job titles that use the Digital Earth include GIS jobs, such as GIS Analyst or GIS technician; often within government, resource management, or environment and conservation sectors of the economy. As Digital Earth tools become more accessible and pervasive, new opportunities and career paths will open up at the interface of these areas in specific sectors. More recently, data scientist and spatial data scientist jobs are emerging, encompassing a wider variety of skills that have to do with processing, analyzing, visualizing, and making sense of geospatial data in order to improve decision-making. This includes some skills in statistics, programming, cloud computing, machine learning, and project management.
Many career paths in physical geography, human geography and social sciences, ecology, etc. are increasingly dependent on having some Digital Earth skills and experience. This sort of career path will be different from GIS Experience, but include the full suite of interacting technologies that comprise the Digital Earth. As more and more data becomes accesible and part of Digital Earth systems, and more integrated and interconnected, new career paths will open up at these critical junctures, for example geographic information and artificial intelligence, scenarion modelling and environmental forecasting, and public and stakeholder engagement with geovisualization tools.
1.7 Summary
At this point, it is worth revisiting some key ideas we have covered thus far. Firstly, the Digital Earth is not a single tool or technology, but an expansive vision of a system for managing every aspect of the environment, and the natural and social worlds which comprise it. This system is dependent on a variety of core technologies which have matured over the past 40 years, but are ever evolving and improving. Secondly, geospatial data; data that are anchored to locations on the earth, are crucial to the Digital Earth. Only when individual datasets can know their relation to other datasets does the power of spatial analysis become apparent. The utility of geospatial datasets increases as more and more data are geographically referenced to the same model of the earth. Finally, the Digital Earth is comprised of representations of reality; often modelled as thematic layers. There are different data models for abstracting the real world into the Digital Earth - and decisions around this abstraction process have important implications for what we can do with the data. We will be delving into many of the topics covered in this introductory lesson in further detail in the coming weeks.
1.7.1 Key Terms
- Geographic Information Systems
- Satellite-based Earth Observation
- Global Navigation Satellite Systems
- Geographic Information Science
- thematic layers
- object data model
- field data model
- webmap